Most people know that they should be drinking filtered water. But the way you filter matters depending on what contaminants are in there. And, just as important: you need to think about your shower and sinks. For some contaminants, hot showers will give you a bigger dose than drinking the same water!
This page starts with how you consume contaminants in water, how legal limits compare with health benchmarks, and what different filter types are and aren't good for. Then we go through the research, contaminant by contaminant, and how we test the water in your home.
Water reaches your body in three main ways: you drink it, you breathe it in as vapor, and it soaks in through your skin. Metals come in almost entirely through drinking them (they are barely absorbed or inhaled). The chlorination byproducts called THMs come in largely in the shower, through skin and breath 12.
Legal tap water isn't necessarily healthy. Large studies have found higher risk under US legal limits for arsenic, uranium, and chlorination byproducts 345, and at least one PFAS was detectable in an estimated 45% of US tap water samples 6.
We sort what's in water into six exposures. Five of them are negative to have in your water. One (minerals) is positive, and you want to avoid filtering them out!
Exposure 1 · Mostly what you drink
Metals
Metals that get into water from rock and old pipes, like lead, arsenic, uranium, copper, and lithium.
We suggestKeep lead, arsenic, and uranium out of the water you drink.
In some cases, the evidence is cut-and-dried, and eliminating a negative exposure or adding a positive one is an obvious choice.
But most situations aren't like that. For those, we believe in the Precautionary Principle. When there's credible signal of risk, the source is in your home, and the fix is simple, our preference is to act early and preventatively instead of waiting for complete scientific consensus. This is especially true if you suspect you might be feeling negative effects that could be caused by a prospective exposure. “No (or uncertain) evidence of harm” is not the same as “evidence of no harm” or “evidence of safety.”
We also believe there's a big gap between the higher certainty required to make changes at a societal level, and the low certainty required to make a simple change yourself and see how you feel, and we're focused on the latter.
And of course, this is all subject to change as the science continues to evolve.
Settled Shown in trials. Randomized trials in people show the effect, and reviews agree.
Consistent Large studies agree. Big studies and pooled analyses point the same way, but trials are small or not possible.
Emerging Early, and growing. Newer or smaller studies agree, and the finding needs to be replicated.
Unsettled Evidence is split. Different kinds of studies disagree, so we make sure to consider and show both sides.
How it works
The basics of water at home
Three things decide how much a contaminant matters in your home: how it gets into you, how much of it there is, and whether your filter actually catches it.
The routes
Different contaminants get into your body in different ways.
Which of the three routes matters depends on the contaminant.
Metals like lead don't evaporate and barely cross the skin, so nearly all of your dose comes from drinking. Chlorination byproducts called THMs are the opposite. They're volatile, so a hot shower releases them into the air, and they pass through skin too 128. Haloacetic acids, another group of chlorination byproducts, barely cross the skin, so for them drinking is the main route 28.
That's why we test drinking water and bathing water separately.
Metals come in through drinking; THMs mostly through the shower
DrinkingSkinBreath
MetalsLead, arsenic, uranium, copper, lithium
Main routeMinorMinor
Other inorganicsFluoride, nitrate, salts
Main routeMinorMinor
PFASPFOA, PFOS, and related chemicals
Main routeMinorMinor
Haloacetic acidsA chlorination byproduct that stays in the water
Main routeMinorMinor
THMsChloroform and other volatile byproducts
Also a routeMain routeMain route
Other VOCsSolvents and other volatile organic chemicals
Main routeAlso a routeAlso a route
Main routeAlso a routeMinor
The shower
A shower can put more THMs in your blood than drinking the same water.
In a classic CDC study, a 10-minute shower raised blood THM levels more than drinking a liter of the same water 2. During a shower, about as much chloroform comes in through the skin as through the lungs 1. In lab tests, the THMs skin absorbs from a daily bath came to 40% to 70% of the daily drinking dose 28.
The route of ingestion also changes how your body processes the contaminant. Swallowed chloroform passes through the liver, which breaks much of it down before it reaches the rest of the body. Breathed and absorbed chloroform skips that step and goes straight into circulation 29.
The air in the bathroom matters too. The chloroform level in the shower stall's air was the strongest predictor of blood levels afterward 30. Among 12 household water uses, only showering and bathing significantly raised the chloroform in people's breath 31, and in a 30-minute bath, breath chloroform kept rising the whole time 32. In another study of 14 uses, showering, bathing, and washing dishes by hand raised blood THMs the most 33.
Chloroform from a shower reaches the blood more directly than chloroform you drink
Drinkinga liter of tap water
Showeringfor 10 minutes
Swallowedinto the gut
Breathed inas vapor
Through the skinwhile you wash
Liverbreaks much of it down
Bloodstreamcarried through the body
Passes the liver firstGoes straight into circulation
The benchmark
Legal limits can be far above health goals.
Every regulated contaminant has a legal limit. In the US, that's the EPA's maximum contaminant level, or MCL. Many also have a health goal, the MCLG, which can be far lower. For PFOA and PFOS, the goal is zero and the legal limit is 4 parts per trillion 34.
On this page, the health guidance level means the most protective benchmark any public health agency has set for a contaminant, such as an EPA goal or a California public health goal. Water at or near it over a lifetime is thought to be safe.
On top of that, we're always discovering and regulating new contaminants. For example, disinfection byproducts (of which THMs are one type) are increasingly becoming regulated, and many unregulated ones are known to be cytotoxic 35.
Studies found risk well under the legal limit
Level where higher risk began, as a share of each contaminant's legal limit, log scale
The legal limit
Atrazine: smaller babies24,154 Indiana births 36
0.1 of 3 µg/L
Nitrate: colorectal cancer2.7 million Danes 20
3.87 of 50 mg/L
THMs: colorectal cancer in menTwo Swedish cohorts 37
15 of 80 µg/L
Uranium: kidney disease88,185 California women 4
10 to 15 of 30 µg/L
Arsenic: heart disease98,250 California women 3
5 of 10 µg/L
Arsenic: children's IQMaine well water 38
5 of 10 µg/L
Nitrate: very early preterm birth1.44 million California births 19
5 of 10 mg/L
THMs: bladder cancerPooled across studies 5
41 of 80 µg/L
Nitrate limits differ by unit: 50 mg/L as nitrate in the EU (Danish study), 10 mg/L as nitrate-nitrogen in the US (California study). THMs are shown against the US limit of 80 µg/L; the EU limit is 100.
The filter
No filter catches everything.
Each type of filter is built for different contaminants. Carbon is good at chlorine and THMs, and it reduces many PFAS, though less reliably 39. It isn't built for fluoride, nitrate, or arsenic 40. Reverse osmosis pushes water through a membrane fine enough to stop almost anything, but also stops the calcium and magnesium you'd rather keep in 41. And a drinking water filter does nothing for the shower, of course.
So the right filter depends on what's actually in your water, and the way to check it's working is to test the water before and after the filter. Filters wear out, too. A carbon cartridge that isn't replaced on schedule can fill up and start releasing what it caught back into the water 41.
Each kind of filter catches different things
What each filter type is typically built to remove. Select a filter for more.
LeadMetal
ReducesRemoves mostRemoves mostNot built for itNot built for itNot built for it
ArsenicMetal
Not built for itNot built for itRemoves mostNot built for itNot built for itNot built for it
UraniumMetal
Not built for itNot built for itRemoves mostNot built for itNot built for itNot built for it
FluorideInorganic
Not built for itNot built for itRemoves mostNot built for itNot built for itNot built for it
NitrateInorganic
Not built for itNot built for itRemoves mostNot built for itNot built for itNot built for it
PFASForever chemicals
ReducesReducesRemoves mostNot built for itReducesNot built for it
ChlorineDisinfectant
ReducesRemoves mostRemoves mostReducesRemoves mostNot built for it
THMsChlorination byproducts
Not built for itRemoves mostRemoves mostNot built for itReducesNot built for it
Calcium and magnesiumMinerals worth keeping
Not built for itNot built for itRemoves mostNot built for itNot built for itRemoves most
Removes mostReducesNot built for itStrips minerals you want
Mainly better taste and less chlorine 42. Some pitchers are certified for lead or PFAS, and many aren't, so check 43. In a study of filters in people's homes, pitchers and other small carbon filters removed PFAS unevenly 39.
A denser block of carbon with more contact time. Good for chlorine and THMs, and for lead if it's certified for lead under NSF/ANSI 53 40. It reduces PFAS, the long-chain ones like PFOA and PFOS better than the short-chain ones 44. It isn't built for fluoride, nitrate, or arsenic.
The broadest drinking water filter 41, and the one we recommend most. Each contaminant is a separate certification claim, so check for the ones in your water. The arsenic claim covers only one of arsenic's two forms 40. It also takes out the minerals, so choose one that adds them back.
Shower filters are certified for one thing, free chlorine, under NSF/ANSI 177 40. That standard doesn't cover THMs or chloramine, so we treat a shower filter as partial protection. For THMs in the shower, the filter that does the work is carbon where water enters the home.
Carbon at the point where water enters the home, so every tap and shower is covered. How much it removes depends on its size and how fresh the carbon is: in one study, four of eight whole-home carbon systems had more PFAS in the filtered water than in the unfiltered 39. Usually paired with a reverse osmosis system at the kitchen sink for drinking water.
Swaps calcium and magnesium for sodium to stop scale, which adds sodium to your water 41. It isn't built for any of the contaminants above.
Exposure 1 · Mostly what you drink
Metals.
Metals get into water from rock and old pipes, and at tap water levels you can't taste or smell them. Lead has some of the strongest evidence on this page, and the evidence on lithium is the most mixed.
Consistent
Lead
3.9pointsof IQ lost as children's blood lead rose from 2.4 to 10 µg/dL, more than half the loss seen all the way to 30 7
In a pooled analysis of seven cohorts, children's IQ fell 6.9 points as blood lead rose from 2.4 to 30 µg/dL, and the first, smallest increase did the most damage 7. Lead is also linked to inattention and hyperactivity, about as strongly as it is to IQ 45.
Tap water is a real source. After Flint switched its water supply, the share of young children with elevated blood lead doubled, from 2.4% to 4.9%, with no change outside the city 46. In two Midwest cities, an EPA analysis found that lead service lines predicted elevated blood lead in children better than measures based on lead paint 47.
In adults, blood lead rising from 1.0 to 6.7 µg/dL was associated with 70% higher cardiovascular death over about 19 years 48, and a systematic review judged the evidence strong enough to conclude that lead causes high blood pressure 49.
Key studies9 studies
7Lanphear et al. (2005)Environ Health PerspectPaper ↗Blood lead rising from 2.4 to 30 µg/dL was associated with a 6.9-point IQ decrement; the steepest loss (3.9 points) occurred between 2.4 and 10 µg/dL, and the slope was significantly steeper in children with maximal blood lead below 7.5 µg/dL.Pooled analysis of 7 prospective cohorts, n=1,333 children. Limits: Blood lead reflects all sources, including paint and dust.
46Hanna-Attisha et al. (2016)Am J Public HealthPaper ↗Elevated blood lead incidence rose from 2.4% to 4.9% after the water source change, with a 6.6% increase in neighborhoods with the highest water lead; no change outside the city.Pre/post spatial analysis of blood lead in children under 5. Limits: Observational natural experiment; elevated blood lead is an exposure outcome, not a measured IQ decline.
48Lanphear et al. (2018)Lancet Public HealthPaper ↗Blood lead rising from 1.0 to 6.7 µg/dL was associated with HR 1.70 for cardiovascular mortality and 2.08 for ischemic heart disease mortality; estimated 412,000 US deaths per year attributable.NHANES III cohort, n=14,289, median 19.3 years follow-up. Limits: Blood lead reflects all sources, not only drinking water; one baseline blood measurement and residual confounding.
45Goodlad et al. (2013)Clin Psychol RevPaper ↗Lead exposure correlated with inattention (r=0.16) and hyperactivity/impulsivity (r=0.13), similar in magnitude to the lead-IQ association.Meta-analysis of 33 studies, n=10,232 children and adolescents.
47Tornero-Velez et al. (2025)Environ Sci TechnolPaper ↗Lead service line prevalence correlated strongly with elevated child blood lead (r=0.71 and r=0.83) and outperformed paint-based risk indices as a predictor.EPA census tract analysis, Cincinnati and Grand Rapids.
49Navas-Acien et al. (2007)Environ Health PerspectPaper ↗Evidence sufficient to infer a causal relationship between lead and hypertension; suggestive for clinical CVD, with some associations at blood lead below 5 µg/dL.Systematic review of observational studies.
50McFarland et al. (2022)PNASPaper ↗Over 170 million Americans alive today were exposed to high lead levels in early childhood, with an estimated 824 million IQ points lost as of 2015.Population modeling of US birth cohorts 1940 to 2015.
51Trejo et al. (2024)Sci AdvPaper ↗The crisis decreased math achievement and increased special-needs classification, even among children in homes with copper (not lead) service lines.Synthetic control analysis of Michigan administrative education data.
52Nawrot et al. (2002)J Hum HypertensPaper ↗Doubling blood lead was associated with +1.0 mmHg systolic and +0.6 mmHg diastolic pressure.Meta-analysis of 31 studies, n=58,518.
Counterpoints. Blood lead reflects every source, including paint and dust, so these studies don't say what a given tap water level does. And per person, the blood pressure effect is small: about 1 mmHg for each doubling of blood lead 52.
Consistent
Arsenic, even under the limit
20%higher ischemic heart disease risk with arsenic at 5 to 9.99 µg/L, under the US limit, in 98,250 women 3
Arsenic occurs naturally in groundwater. In California women on regulated public water, arsenic at 5 to 9.99 µg/L was associated with 20% higher ischemic heart disease risk than under 1 µg/L 3. In two US cohorts, each doubling of water arsenic was associated with 10% higher type 2 diabetes risk, including below 10 µg/L 53, and Maine children drinking well water with 5 µg/L or more scored 5 to 6 IQ points lower 38.
Lower exposure was associated with lower risk. In Bangladesh, people whose arsenic levels fell ended up with cardiovascular death rates similar to people whose exposure had always been low 54. At high levels, arsenic causes cancer decades later: in Chile, bladder cancer death rates were still about five to six times higher 40 years after the exposure ended 55.
Key studies10 studies
3Medgyesi et al. (2024)Environ Health PerspectPaper ↗Versus <1 µg/L, ischemic heart disease HR was 1.20 at 5 to 9.99 µg/L and 1.42 at ≥10 µg/L; each doubling of water arsenic raised IHD risk 4%.Prospective cohort, n=98,250 women, 1995 to 2018. Limits: Observational; exposure is water-system averages, not personal consumption.
54Wu et al. (2025)JAMAPaper ↗Each IQR decrease in urinary arsenic was associated with 23% lower CVD mortality and 20% lower cancer mortality; people whose levels fell below the median had risks similar to the consistently low-exposed (aHR 0.43 for CVD).HEALS prospective cohort, n=10,977, Bangladesh, mortality through 2022. Limits: Mitigation was not randomized; baseline contamination in Bangladesh was often high.
53Spaur et al. (2024)Diabetes CarePaper ↗Each doubling of community water arsenic was associated with HR 1.10 for type 2 diabetes; associations held at levels below 10 µg/L.Two prospective cohorts, n=7,568. Limits: Exposure assignment and residual confounding remain; the 2026 Boffetta review provides conflicting low-dose synthesis.
38Wasserman et al. (2014)Environ HealthPaper ↗Well water arsenic ≥5 µg/L was associated with a 5 to 6 point lower full-scale IQ vs <5 µg/L after adjusting for maternal IQ and home environment.Cross-sectional, n=272 US children.
56Moon et al. (2013)Ann Intern MedPaper ↗Highest vs lowest urinary arsenic quartile: HR 1.65 for CVD mortality, 1.71 for CHD mortality, and 1.32 for incident CVD.Strong Heart Study cohort, n=3,575 American Indian adults, follow-up to 2008.
55Smith et al. (2018)J Natl Cancer InstPaper ↗Decades after exposure ended, bladder cancer mortality RR was 4.79 (men) and 6.43 (women) and lung cancer RR 3.38 (men) vs the rest of Chile.Population mortality study, Antofagasta, Chile natural experiment. Limits: Historically very high exposures and regional comparisons.
57Argos et al. (2010)LancetPaper ↗All-cause mortality HR 1.68 at 150 to 864 µg/L vs ≤10 µg/L.Prospective cohort, n=11,746. Limits: Much of the exposure range was far higher than typical regulated US supplies; low-dose strata were less precise.
58Boffetta & Borron (2019)Dose ResponsePaper ↗Meta-RR per 10 µg/L was 1.03 (lung) and 1.02 (bladder), null up to 150 µg/L. Author disclosed litigation expert role. Deng 2026 also found no clear urologic cancer dose-response at or below 10 µg/L, so the low-level arsenic evidence is stronger for CVD and diabetes than for cancer.
59Boffetta et al. (2026)Eur J EpidemiolPaper ↗The initial positive association attenuated to null after publication-bias and quality analyses.Systematic review and dose-response meta-analysis; 11 studies, 12 populations. Limits: Authors defined low exposure as averages up to 150 µg/L, much above the US limit; method-sensitive synthesis; Arsenic Science Task Force funding and author consulting disclosed.
60Deng et al. (2026)JAMA Netw OpenPaper ↗Top vs bottom arsenic tertile: RR 1.60 for bladder cancer and 3.37 for urothelial carcinoma; the dose-response rose above 10 µg/L but was not evident at or below 10 µg/L. Cadmium RR 1.38 for urologic cancer.Meta-analysis of 62 studies.
Counterpoints. At low levels, the evidence is stronger for heart disease than for cancer: at or below 10 µg/L, pooled studies found no clear rise in cancer with dose 6058, and one review found the diabetes link faded after accounting for publication bias 59. Water-system averages also aren't what each person actually drank.
Emerging
Uranium
33%higher chronic kidney disease risk with uranium at one-third to one-half the 30 µg/L limit 4
Uranium gets less attention than lead or arsenic, but it is widespread. It was detected in 63% of US community water system records, and 2.1% of systems were over the legal limit 61. In California women, uranium at 10 to 15 µg/L was associated with 33% higher chronic kidney disease risk than under 2 µg/L 4.
Uranium in tap water shows up in the body: each doubling of uranium in community water raised the level in people's urine by 35%, even below the limit 62. In a multi-ethnic US cohort, people with the most uranium in their urine had 32% higher risk of cardiovascular disease 63.
Key studies5 studies
4Medgyesi et al. (2025)Am J Kidney DisPaper ↗Uranium at 10 to <15 µg/L (one-third to one-half the 30 µg/L limit) was associated with HR 1.33 for CKD vs <2 µg/L.California Teachers Study cohort, n=88,185.
61Ravalli et al. (2022)Lancet Planet HealthPaper ↗2.1% of systems exceeded the uranium MCL and 2.6% the arsenic MCL; uranium detected in 63% of records; higher in semi-urban Hispanic communities.Cross-sectional, 37,915 community water systems.
62Spaur et al. (2024)J Expo Sci Environ EpidemiolPaper ↗Each doubling of community water uranium raised urine uranium by 35% and arsenic by 11%, even below regulatory limits.SHFS and MESA, up to 6,722 participants.
63Martinez-Morata et al. (2024)CirculationPaper ↗Highest vs lowest quartile of urinary uranium HR 1.32 for incident CVD and mortality; cadmium HR 1.68 for mortality; copper HR 1.42 for CVD.MESA cohort, n=6,599, follow-up to 2019.
64Spaur et al. (2026)Environ ResPaper ↗HR 0.97 per doubling of water uranium; null at low exposure (median <1.2 µg/L).
Counterpoints. The kidney finding comes from one cohort and needs replication, and in two other US cohorts, water uranium wasn't linked to diabetes at low levels 64.
Settled
Copper and nickel: short-term symptoms
4mg/Lcopper in water, where stomach symptoms began in women, in a double-blind randomized trial 8
Copper is one of the few water contaminants tested in randomized trials. In a double-blind trial of 1,365 adults, stomach symptoms rose with copper in drinking water, significantly in women at 4 mg/L and in men at 6 mg/L 8. An earlier controlled trial put the level with no short-term effect at 4 mg/L 65.
Nickel is a different kind of problem, an allergy: about 1% of nickel-sensitive people may react to the normal daily nickel they get from water and food 66.
Key studies3 studies
8Araya et al. (2004)Environ Health PerspectPaper ↗GI symptoms rose with copper; significant in women at 4 mg/L (RR 1.53) and men at 6 mg/L in week 1.Randomized double-blind trial, n=1,365 adults, 2 months.
65Araya et al. (2001)Regul Toxicol PharmacolPaper ↗Acute NOAEL 4 mg/L and LOAEL 6 mg/L for nausea and GI symptoms.Double-blind controlled multi-site trial, n=179.
66Jensen et al. (2006)Contact DermatitisPaper ↗About 1% of nickel-sensitive people may react at normal daily nickel intake from water and diet (0.22 to 0.35 mg).Meta-analysis of 9 provocation studies.
Counterpoints. These are short-term symptoms at levels well above what most homes have, and the trials don't speak to long-term disease. The nickel reaction applies to people already allergic to nickel.
Unsettled
Lithium
46%higher odds of autism in children whose mothers' water had the most lithium, in Denmark 9
Lithium is a light metal that dissolves into some groundwater from rock, and the research on it is split. In a Danish nationwide study, more lithium in a mother's drinking water was associated with higher odds of autism in her child 9, and a small cohort in the Argentinean Andes linked lithium in pregnancy to altered thyroid hormones 67.
On the other side, across 15 ecological studies, regions with more lithium in their water had lower suicide rates 10, and in Denmark, the most lithium was associated with 17% less dementia 68.
Points to a risk
Studies2 studies
9Liew et al. (2023)JAMA PediatrPaper ↗Each IQR increase in maternal water lithium OR 1.23 for ASD; highest quartile (>16.78 µg/L) OR 1.46.Nationwide case-control, 8,842 ASD cases and 43,864 controls. Limits: Single study using spatially modeled exposure; no individual intake measurement or causal threshold.
67Harari et al. (2015)ThyroidPaper ↗Blood lithium positively associated with TSH and inversely with T3/fT3 and transthyretin.Prospective mother-child cohort, n=194, Argentinean Andes.
Points the other way
Studies3 studies
10Memon et al. (2020)Br J PsychiatryPaper ↗Consistent inverse association between water lithium and total suicide rates (pooled β -0.27).Meta-analysis of 15 ecological studies.
69Eyre-Watt et al. (2021)Aust N Z J PsychiatryPaper ↗Higher water lithium associated with lower suicide rates (r=-0.191, 14 studies) and fewer psychiatric admissions; publication bias detected.Meta-analysis, 27 studies, 113 million people.
68Kessing et al. (2017)JAMA PsychiatryPaper ↗>15 µg/L vs 2 to 5 µg/L: IRR 0.83 for dementia; non-linear, with 5.1 to 10 µg/L showing IRR 1.22.Danish nested case-control, 73,731 dementia cases and 733,653 controls. Limits: Municipality-level confounding and nonlinear estimates.
Counterpoints. The risk side rests on single studies. The other side rests on ecological studies that compare regions rather than people, with signs of publication bias 69. The dementia pattern wasn't a straight line either: a middle range of lithium was associated with 22% more dementia 68. None of it sets a safe or harmful level.
What we suggest
Low metals. Find out what your service line and pipes are made of, and test before you buy a filter. For lead, choose a filter certified for lead under NSF/ANSI 53, which many carbon filters are, or a reverse osmosis system 4340. Arsenic and uranium usually take reverse osmosis 41. If a lead service line is being replaced, keep filtering through the work: in Washington, DC, fetal deaths spiked again after partial lead service line replacements 70.
Exposure 2 · Drinking and bathing water
Minerals.
Not everything dissolved in water is a contaminant. Calcium and magnesium make water hard. With these, the question is how much is right, and the evidence is mixed.
Unsettled
Magnesium and the heart
25%lower odds of cardiovascular death with more magnesium in water, in a review of 14 studies 11
Calcium and magnesium are essential, and the body absorbs calcium from water at least as well as from dairy 71. In a systematic review, more magnesium in drinking water was associated with 25% lower odds of cardiovascular death 11, and a separate meta-analysis of 10 studies found 11% lower coronary heart disease death 72. In rural Finland, each extra 1 mg/L of magnesium in groundwater was associated with 4.9% fewer heart attacks 73. After Israel switched much of its supply to magnesium-poor desalinated seawater, ischemic heart disease rose in a large health-system cohort 74.
A WHO expert review weighed how much of our calcium and magnesium comes from water, and the evidence that harder water may be associated with lower risk of some diseases 75. Of 28 EU countries, 19 regulate hardness, calcium, or magnesium in drinking water by law or guidance 76.
Key studies9 studies
11Catling et al. (2008)J Water HealthPaper ↗Pooled OR 0.75 for CVD mortality with higher water magnesium; calcium evidence unclear; cohort studies showed no clear hardness effect.Systematic review, 14 studies (9 case-control, 5 cohort).
72Jiang et al. (2016)NutrientsPaper ↗Higher water magnesium RR 0.89 for CHD mortality (0.83 in European studies).Meta-analysis, 10 studies, 77,821 CHD cases.
74Shlezinger et al. (2018)Environ ResPaper ↗Ischemic heart disease odds rose (OR 0.96 at baseline to 1.06 at end) after magnesium-poor desalinated water supply; diabetes and CRC unchanged.Population-based historical cohort (Clalit), 2004 to 2013.
73Kousa et al. (2006)Environ Health PerspectPaper ↗Each 1 mg/L more magnesium lowered AMI risk 4.9%; each unit higher Ca:Mg ratio raised it 3.1%.Small-area Bayesian study, 14,495 first AMIs.
77Rapant et al. (2021)Environ Geochem HealthPaper ↗Soft-water municipalities had 56% higher relative CVD mortality and over 4.5 years shorter life expectancy than hard-water ones.Ecological, 53 municipalities, 15-year averages.
75WHO, eds. Cotruvo and Bartram (2009)Expert meeting report (guideline context)Paper ↗Reviews evidence that hard water may be associated with reduced risks of some diseases, plus water's share of dietary intake.WHO expert meeting report (eds. Cotruvo and Bartram).
76Kozisek (2020)Regul Toxicol PharmacolPaper ↗States that drinking water low in magnesium significantly increases likelihood of CV mortality; 19 countries regulate hardness/Ca/Mg by law or guidance.Regulatory review, 28 EU countries.
71Quattrini et al. (2016)Clin Cases Miner Bone MetabPaper ↗Reviews classification and health effects of mineral waters including calcium and magnesium content.Narrative review.
78Gianfredi et al. (2017)J Water HealthPaper ↗Higher water calcium and magnesium were associated with lower cardiovascular risk, but results were heterogeneous and showed publication bias.Systematic review and meta-analysis of case-control studies; Seven studies, approximately 44,000 participants. Limits: Dietary and regional confounding.
Counterpoints. Most of this evidence compares places, or people who died of heart disease with people who didn't. Good-quality cohort studies haven't shown a clear effect of hardness 11, and pooled results vary, with signs of publication bias 78. None of it shows that adding minerals back improves health.
Unsettled
Hard water and eczema
No benefitfrom a home water softener in a randomized trial of children who already had eczema 13
The same minerals may irritate skin. In 1,303 three-month-old babies, harder water was associated with more visible eczema 79, and a review of 16 studies found hard water linked to childhood eczema 12. In a lab study, washing in hard water left more detergent on the skin and irritated the skin barrier 80.
But in a randomized trial of children who already had eczema, a water softener added no objective benefit over usual care 13.
Points to a risk
Studies3 studies
79Perkin et al. (2016)J Allergy Clin ImmunolPaper ↗Higher water hardness was associated with visible eczema; the independent chlorine contribution was uncertain.Population-based cross-sectional study; 1,303 three-month-old infants. Limits: Cross-sectional; hardness and chlorine were correlated.
80Danby et al. (2018)J Invest DermatolPaper ↗Hard water increased detergent deposition and skin-barrier irritation; a clear independent chlorine effect was not observed.Controlled skin-washing experiment; 80 participants with/without eczema and FLG mutations. Limits: Localized experimental exposure; measures skin-barrier endpoints, not eczema.
12Jabbar-Lopez et al. (2021)Clin Exp AllergyPaper ↗Hard-water exposure was associated with childhood eczema, but softener trials did not improve objective severity.Systematic review and meta-analysis; 16 studies; seven observational studies included 385,901 participants. Limits: Observational association was very-low-certainty; the trials tested treatment, not prevention.
Points the other way
Studies2 studies
13Thomas et al. (2011)PLoS MedPaper ↗A home ion-exchange softener added no objective eczema benefit over usual care.Observer-blind randomized controlled trial; 336 children with moderate/severe eczema. Limits: Addresses treatment of established childhood eczema, not all skin comfort outcomes or prevention from birth.
81Jabbar-Lopez et al. (2022)Clin Exp AllergyPaper ↗Softener installation and infant follow-up were feasible; eczema estimates were imprecise and the trial was not designed to establish efficacy.Assessor-blinded pilot randomized trial; 80 families randomized; 78 remained after initial withdrawals. Limits: Pilot endpoints were feasibility; wide confidence intervals and no efficacy hypothesis testing.
Counterpoints. The softener trial treated eczema that already existed. Whether softening from birth prevents it is still open: a pilot trial was too small to say 81.
What we suggest
Keep the minerals. Reverse osmosis, the usual fix for arsenic and uranium, also takes out calcium and magnesium 41. So choose a system that remineralizes, or add minerals back. A WHO expert report reviews what's known about drinking water with its minerals removed 82. Naturally mineralized spring water is another option.
Exposure 3 · The shower and the tap
Chlorination byproducts.
Disinfection keeps tap water safe from germs, but chlorine reacts with organic matter in the water to form byproducts like THMs and haloacetic acids. You drink both, and in a hot shower you also breathe THMs in and absorb them through your skin 2.
Consistent
Bladder and colorectal cancer
1.33×the risk of bladder cancer with the most THM exposure, across studies 5
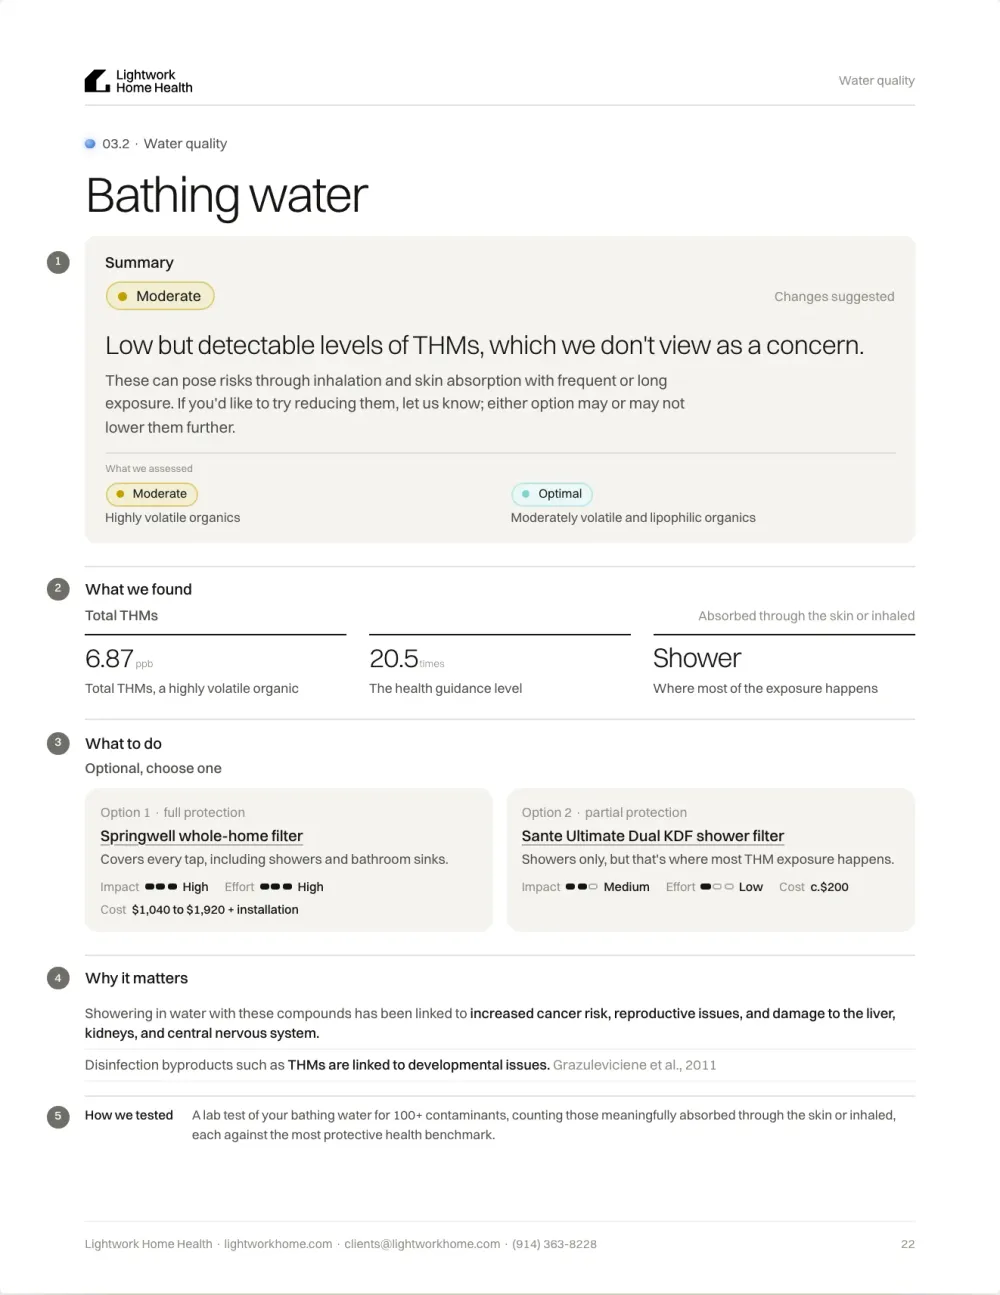
A 2025 dose-response meta-analysis found bladder cancer risk 33% higher with the most THM exposure, rising significantly above 41 µg/L, and colorectal cancer risk 15% higher, both at levels below the US and EU limits of 80 and 100 µg/L 5. In pooled data, men with THMs above 50 µg/L had 44% higher odds of bladder cancer 83, and in Swedish cohorts, THMs of 15 µg/L or more were associated with 26% higher colorectal cancer risk in men 37. Across the EU, an estimated 4.9% of bladder cancers, about 6,500 a year, may be attributable to THMs 84.
Showers count here as well. In a Spanish study of 1,219 people with bladder cancer and 1,271 without, time spent in showers and baths, weighted by THM levels, was associated with 83% higher odds of bladder cancer, and swimming in pools with 57% higher. The link with drinking alone was not statistically significant 85.
Key studies7 studies
5Helte et al. (2025)Environmental Health PerspectivesPaper ↗Highest vs lowest THM exposure: bladder cancer RR 1.33 (1.04-1.71), significant above 41 ug/L; colorectal cancer RR 1.15 (1.07-1.24).PROSPERO-registered systematic review and dose-response meta-analysis; 29 publications, 14 cancers; bladder (5,860 cases) and colorectal (9,262 cases) pooled.. Limits: Observational evidence, heterogeneous mixtures and routes.
83Villanueva et al. (2004)EpidemiologyPaper ↗Men exposed to average THM >1 ug/L had OR 1.24 (95% CI 1.09-1.41), rising to OR 1.44 (1.20-1.73) above 50 ug/L; no association in women (OR 0.95).Pooled analysis of 6 case-control studies (US, Canada, France, Italy, Finland); 2,806 cases, 5,254 controls.. Limits: Historical reconstructed exposure and case-control biases; partly overlaps later evidence syntheses.
85Villanueva et al. (2007)American Journal of EpidemiologyPaper ↗Household THM >49 vs <=8 ug/L OR 2.10 (1.09-4.02); shower/bath duration weighted by THM OR 1.83 (1.17-2.87) top vs bottom quartile; swimming in pools OR 1.57 (1.18-2.09); ingestion alone OR 1.35 (0.92-1.99, not significant).Case-control study in Spain, 1,219 cases and 1,271 controls, lifetime water-use histories.. Limits: Recalled lifetime habits and correlated routes prevent clean causal attribution.
37Helte et al. (2023)J Natl Cancer InstPaper ↗THM >=15 ug/L associated with HR 1.26 (1.05-1.51) for colorectal cancer in men, and HR 1.59 (1.11-2.27) for proximal colon cancer; no association in women.Two Swedish population-based cohorts, n=58,672, mean follow-up 16.8 years, 1,913 cases.. Limits: Observational exposure estimates; sex-specific findings need replication.
84Evlampidou et al. (2020)Environmental Health PerspectivesPaper ↗Population-weighted mean THM 11.7 ug/L; estimated 4.9% of bladder cancers (6,561 cases/year) attributable to THMs, up to 23% in Cyprus.Burden-of-disease analysis using THM monitoring data from 26 EU countries (75% of population) and a pooled exposure-response function..
86Costet et al. (2011)Occup Environ MedPaper ↗Men with average residential THM >50 ug/L had OR 1.47 (1.05-2.05) vs <=5 ug/L; risk rose significantly above 25 ug/L.Pooled and meta-analysis of 3 European case-control studies (2,381 cases, 3,086 controls)..
87Donat-Vargas et al. (2023)Environ Health PerspectPaper ↗Waterborne ingested THMs not associated with prostate cancer in MCC-Spain.
Counterpoints. The cancer links are clearest in men; several studies found none in women 8337. These are observational studies of decades of exposure. People recalled a lifetime of habits, and the routes overlap, so these studies can't separate the risk from drinking from the risk from showering.
Unsettled
Pregnancy
2.2×the odds of low birth weight with the most chloroform, counting drinking, showers, and baths, in 4,161 pregnancies 14
In a meta-analysis of 16 publications, haloacetic acids were associated with 12% higher odds of babies born smaller than expected 88, and one of them, dichloroacetic acid, with 1.5 to 1.7 times the odds of stillbirth 89. In a Lithuanian cohort that counted showering and bathing in each woman's dose, the most chloroform was associated with 2.2 times the odds of low birth weight 14.
On the other side, a meta-analysis of 15 studies found little or no link between THMs and birth weight 15. A Spanish birth cohort that estimated 89% of chloroform uptake came from showering and bathing also found no link with birth weight or preterm birth 90.
Points to a risk
Studies4 studies
88Summerhayes et al. (2021)Environmental ResearchPaper ↗Small increased SGA risk for THM4 (OR 1.07, 1.03-1.11) and larger for haloacetic acids: HAA5 OR 1.12 (1.01-1.25), dichloroacetic acid OR 1.25, trichloroacetic acid OR 1.21 (1.07-1.37).Meta-analysis of 19 study populations from 16 publications..
89Rivera-Núñez et al. (2018)Occup Environ MedPaper ↗Upper dichloroacetic acid quartiles aOR 1.50-1.71 for stillbirth; chloroform aOR 1.29-1.36; BDCM and unexplained stillbirth aOR 1.51-1.78.Case-control study of 2,460 stillbirths with 10 controls each..
14Grazuleviciene et al. (2011)Environmental HealthPaper ↗Highest vs lowest tertile chloroform internal dose: low birth weight OR 2.17 (1.19-3.98); SGA risk rose 4% per 0.1 ug/d.Prospective cohort of 4,161 pregnant women, internal THM dose from drinking, showering, and bathing.. Limits: Internal dose combines drinking, showering and bathing, so the routes are not separated.
91Säve-Söderbergh et al. (2020)Environmental Health PerspectivesPaper ↗Dose-dependent increase in SGA with TTHM >15 ug/L, OR 1.20 (1.08-1.33), confined to hypochlorite-treated water.Swedish nationwide register study, about 500,000 births..
Points the other way
Studies2 studies
15Grellier et al. (2010)EpidemiologyPaper ↗Meta-analysis of 15 studies found little or no association between third-trimester THMs and low birth weight (OR 1.00 per 10 ug/L), term LBW, or preterm delivery; only a very small SGA signal (OR 1.01).
90Villanueva et al. (2011)Environ Health PerspectPaper ↗Spanish INMA cohorts, 2,158 newborns; despite estimating 89% of chloroform uptake came from showering/bathing, THMs were not associated with birth weight, SGA, LBW or preterm delivery.Limits: Exposure modeling and population differences remain.
Counterpoints. These studies estimate each woman's dose from water records and habits rather than measuring it, and birth weight on its own isn't a sign of broader harm to development 14.
What we suggest
Fewer byproducts. A carbon filter certified for THMs takes them out of drinking water 40, but the shower and bath can account for most of your dose: one birth cohort estimated they supplied 89% of chloroform uptake 90. So if your water has THMs, a whole-home carbon filter is the place to start. A shower filter is a smaller step: the certified ones are tested only for chlorine, not THMs 40, but there are shower filters with the activated or catalytic carbon media required to filter out THMs. Run the bathroom fan during and after showers: the air in the stall predicted how much reached the blood 30. None of these studies tested whether filtering shower water improves health, so we see it as a simple precaution.
Exposure 4 · Tap water, city or well
PFAS.
PFAS are a large family of very persistent industrial chemicals, often called forever chemicals. They reach tap and well water alike: at least one PFAS was detectable in an estimated 45% of US samples, with private wells and public supplies looking much the same 6.
Consistent
PFAS and the immune system
49%lower vaccine antibody levels at age 7 in children with twice the PFAS at age 5 16
In children, more PFAS meant weaker antibody responses to tetanus and diphtheria vaccines 16, and the effect lasted into adolescence: each doubling at age 7 was associated with 10% to 30% lower diphtheria antibodies at 13 92. In adults, a meta-analysis of 29 publications linked PFOA and PFOS to slightly higher cholesterol 93.
The National Academies found sufficient evidence of links to reduced antibody response, higher cholesterol, slower fetal and infant growth, and kidney cancer, and advise filtering contaminated drinking water 94. The EPA's health goal for PFOA and PFOS is zero, and its 2024 legal limit is 4 parts per trillion 34.
Key studies8 studies
16Grandjean et al. (2012)JAMAPaper ↗2-fold higher PFAS in child serum at age 5 associated with 49% (23-67%) lower overall antibody concentration; ORs 2.38-4.20 for falling below protective tetanus/diphtheria antibody levels at age 7.Faroe Islands birth cohort, 587 children followed to age 7.. Limits: Specific legacy PFAS and cohort diet; antibody response is a marker, not a measured rate of infections.
92Grandjean et al. (2017)Environmental Health PerspectivesPaper ↗Doubling of PFAS exposure at age 7 associated with 10-30% lower diphtheria antibody at 13; PFOA at 13 associated with about 25% decrease per doubling.Follow-up of Faroese cohort at age 13, n=516..
94NASEM (2022)National Academies consensus reportPaper ↗Sufficient evidence of association for decreased antibody response, dyslipidemia, decreased fetal/infant growth, and kidney cancer; sum of 7 PFAS <2 ng/mL not expected to cause harm, 2-20 ng/mL possible harm, >20 ng/mL higher risk. Advises filtering contaminated drinking water.Consensus report..
93Liu et al. (2023)Environmental Health PerspectivesPaper ↗Per IQR increase, PFOA associated with +2.1 mg/dL total cholesterol and +1.4 mg/dL LDL; PFOS with +2.6 mg/dL total cholesterol and +1.9 mg/dL LDL.Meta-analysis of 29 publications..
95Costello et al. (2022)Environmental Health PerspectivesPaper ↗Higher ALT associated with PFOA (z=6.20, p<0.001), PFOS (z=3.55) and PFNA (z=2.27); rodent studies showed consistent ALT increase and steatosis.Systematic review of 85 rodent and 24 human studies with meta-analysis.. Limits: Raised enzymes are not equivalent to clinical liver disease; mostly legacy PFAS and observational human data.
34US EPA (2024)Federal regulationPaper ↗Final April 10, 2024: MCLs of 4.0 ppt for PFOA and PFOS (MCLG zero), 10 ppt for PFHxS, PFNA, and HFPO-DA, plus a Hazard Index for mixtures. EPA said in May 2025 it would keep the PFOA/PFOS limits; May 2026 proposals would extend PFOA/PFOS compliance to 2031 and rescind the other four limits (proposals, not final).Federal regulation..
6Smalling et al. (2023)Environment InternationalPaper ↗Estimated at least one PFAS detectable in about 45% of US drinking-water samples; private wells and public supply had similar profiles; PFOA and PFOS dominated risk.USGS national survey of tap water at 716 locations (269 private wells, 447 public supply), 2016-2021..
96Steenland et al. (2018)EpidemiologyPaper ↗-10.5 g (-16.7 to -4.4) birthweight per ng/mL PFOA overall, but little association (-3.3 g) when blood was sampled early in pregnancy.Meta-analysis of 24 studies..
Counterpoints. Blood PFAS comes from food and products as well as water, so these studies don't isolate tap water. Antibody levels aren't a measured rate of infections 16.
Emerging
PFAS and cancer
71%higher odds of kidney cancer per doubling of PFOA in the blood, in samples taken before diagnosis 17
IARC classifies PFOA, the best-known PFAS, as carcinogenic to humans, mainly on animal and mechanistic evidence, with limited human evidence for kidney and testicular cancer 97. In general-population blood samples, each doubling of PFOA was associated with 71% higher odds of kidney cancer 17. In 32,254 Ohio Valley residents exposed through drinking water, testicular cancer risk rose with cumulative PFOA, to 3.17 times in the top quarter 98.
Points to a risk
Studies3 studies
97IARC (Zahm et al.) (2023)Lancet OncolPaper ↗PFOA classified Group 1 (carcinogenic to humans) based on sufficient animal evidence and strong mechanistic evidence in exposed humans, with limited human evidence for renal cell carcinoma and testicular cancer; PFOS classified Group 2B.IARC Monographs Volume 135 expert evaluation..
17Shearer et al. (2021)J Natl Cancer InstPaper ↗Each doubling of serum PFOA OR 1.71 (1.23-2.37); highest vs lowest quartile OR 2.63 (1.33-5.20).Nested case-control within PLCO trial, 324 cases and 324 matched controls, prediagnostic serum.. Limits: Not all PFAS showed the same pattern; serum PFOA reflects total exposure from water, food and other sources.
98Barry et al. (2013)Environmental Health PerspectivesPaper ↗Testicular cancer HR 1.34 (1.00-1.79) and kidney cancer HR 1.10 (0.98-1.24) per ln-unit cumulative PFOA; testicular quartile HRs 1.0, 1.04, 1.91, 3.17 (trend p=0.04).C8 Health Project cohort, n=32,254 Mid-Ohio Valley residents exposed via drinking water.. Limits: High-exposure survivor cohort with some occupational exposure; not all estimates were statistically precise.
Points the other way
Studies1 study
18Rhee et al. (2023)Environ IntPaper ↗In the diverse Multiethnic Cohort, PFOA was not associated with renal cell carcinoma overall (OR 0.89), though PFNA was.
Counterpoints. In the diverse Multiethnic Cohort, PFOA wasn't associated with kidney cancer 18, and the Ohio Valley kidney estimate wasn't statistically precise 98. The human cancer evidence needs replication.
What we suggest
Fewer forever chemicals. Choose a filter certified for PFAS under NSF/ANSI 53 or 58 99. Carbon works well on long-chain PFAS like PFOA and PFOS and less well on short-chain ones, and reverse osmosis is typically more than 90% effective across a wide range 44. In North Carolina homes, reverse osmosis and two-stage under-sink filters removed nearly all of the PFAS measured, and other carbon filters varied 39. Certification doesn't yet guarantee a filter gets PFAS below the EPA's limits 99. If you're on a private well, test it, because federal drinking water rules don't cover private wells 100: groundwater serving 71 to 95 million Americans may carry detectable PFAS before treatment 101.
Exposure 5 · Near farms and industry
Farm and industrial chemicals.
Farming and industry leave traces in tap and well water too: nitrate and pesticides from farm runoff, and solvents from industry. Several of these studies found effects well below the legal limits.
Emerging
Nitrate, atrazine, and pregnancy
2.5×the odds of very early preterm birth with nitrate-nitrogen of 10 mg/L or more, comparing siblings, in 1.44 million births 19
The legal limit for nitrate was set to prevent blue baby syndrome in infants, not cancer or problems in pregnancy 102. In California, comparing siblings born to the same mother, the odds of very early preterm birth were 1.47 times higher at 5 to 10 mg/L nitrate-nitrogen, below the federal limit, and 2.52 times at or above it 19. A 2026 EPA review of 267 studies counted birth defects among its most consistent patterns 103.
Atrazine is a common herbicide that runs off farms along with nitrate. In Indiana, more than 0.1 µg/L of it in the third trimester, a thirtieth of the 3 µg/L limit, was associated with 17% to 19% more babies born smaller than expected 36. A meta-analysis of five studies put the odds 11% higher with the most atrazine 104.
Key studies5 studies
19Sherris et al. (2021)Environ Health PerspectPaper ↗Preterm birth at 20 to 31 weeks OR 1.47 at 5 to <10 mg/L and 2.52 at ≥10 mg/L vs <5 mg/L nitrate-N.Within-mother sibling design, 1.44 million births. Limits: Not randomized; water-system exposure estimates do not capture individual water use or filtration.
36Ochoa-Acuña et al. (2009)Environmental Health PerspectivesPaper ↗Third-trimester atrazine >0.1 ug/L associated with 17-19% higher SGA prevalence; no association with preterm delivery.Retrospective cohort, 24,154 births, 19 water systems..
104Ghorbani Nejad et al. (2024)Int J Environ Health ResPaper ↗Highest vs lowest atrazine: SGA OR 1.11 (1.03-1.20), preterm birth OR 1.16 (1.03-1.30), low birth weight OR 1.26 (1.10-1.44).Meta-analysis of 5 studies..
102Ward et al. (2018)Int J Environ Res Public HealthPaper ↗Strongest evidence beyond methemoglobinemia is for colorectal cancer, thyroid disease, and neural tube defects, often below regulatory limits.Narrative review of 30+ studies since 2005 (NCI authors).
103Christensen et al. (2026)J Toxicol Environ Health BPaper ↗Most consistent increased risk patterns for urinary tract, bladder, kidney, prostate, and thyroid cancers, type 2 diabetes, and birth defects.EPA systematic review, 267 human studies.
Counterpoints. These are observational studies using water-system averages, which don't capture what each woman drank or filtered 19. Atrazine wasn't linked to preterm delivery in the Indiana study 36.
Unsettled
Nitrate and cancer
16%higher colorectal cancer risk with the most nitrate, rising from 3.87 mg/L, in 2.7 million Danes 20
In 2.7 million Danes, colorectal cancer risk rose from 3.87 mg/L, about a thirteenth of the 50 mg/L standard 20. The same EPA review that flagged birth defects found its most consistent cancer patterns for urinary tract, bladder, kidney, prostate, and thyroid cancers 103.
On the other side, a meta-analysis of 10 studies found no pooled link with colorectal cancer, though the same review found 1.91 times the odds of stomach cancer per 10 mg/L nitrate 21.
Points to a risk
Studies3 studies
20Schullehner et al. (2018)Int J CancerPaper ↗Highest vs lowest exposure HR 1.16 for colorectal cancer; significant risk above 3.87 mg/L nitrate, far below the 50 mg/L standard.Danish nationwide cohort, 2.7 million adults, 23 million person-years. Limits: Observational and lacking some individual dietary/lifestyle data; nitrate-ion units differ from nitrate-as-nitrogen units.
103Christensen et al. (2026)J Toxicol Environ Health BPaper ↗Most consistent increased risk patterns for urinary tract, bladder, kidney, prostate, and thyroid cancers, type 2 diabetes, and birth defects.EPA systematic review, 267 human studies.
102Ward et al. (2018)Int J Environ Res Public HealthPaper ↗Strongest evidence beyond methemoglobinemia is for colorectal cancer, thyroid disease, and neural tube defects, often below regulatory limits.Narrative review of 30+ studies since 2005 (NCI authors).
Points the other way
Studies1 study
21Picetti et al. (2022)Environ ResPaper ↗Gastric cancer OR 1.91 per 10 mg/L nitrate; no pooled association with colorectal cancer (OR 1.02, 10 studies).Systematic review, 60 cancer studies.
Counterpoints. These are observational studies, and some lacked individual diet data 20. Studies also report nitrate in different units, which makes them hard to compare.
Emerging
Industrial solvents
70%higher Parkinson's risk in veterans whose base water carried the solvent TCE 22
At Camp Lejeune, drinking water carried the solvent TCE at monthly medians more than 70 times the permissible level. Veterans stationed there had 70% higher Parkinson's risk than those at an uncontaminated base 22, and higher risks of several cancers, including acute myeloid leukemia 105.
Key studies2 studies
22Goldman et al. (2023)JAMA NeurologyPaper ↗Camp Lejeune veterans, whose water had TCE at monthly medians >70 times the permissible level, had 70% higher Parkinson risk (OR 1.70, 1.39-2.07), plus more prodromal features.Cohort of 158,122 veterans with health data (Camp Lejeune vs uncontaminated Camp Pendleton)..
105Bove et al. (2024)Environmental Health PerspectivesPaper ↗Elevated risks for myeloid cancers (HR 1.24), acute myeloid leukemia (HR 1.38), myelodysplastic syndromes (HR 1.68), esophageal (HR 1.27) and thyroid cancer (HR 1.22).ATSDR cohort, about 155,000 Camp Lejeune vs 163,000 Camp Pendleton personnel plus civilian workers, registry-linked 1996-2017..
Counterpoints. These were extreme exposures at one site, so they say little about trace levels in a typical home.
What we suggest
Test, then filter. Start with a test, especially if you're on a private well, where testing is up to you 100. Then choose a filter certified for what's in your water. Carbon filters can be certified for atrazine and for solvents like TCE, but not for nitrate, which usually takes reverse osmosis 4041.
Exposure 6 · Drinking water
Fluoride.
Fluoride is the one thing on this page that's added to water on purpose, to protect teeth. At higher levels it's linked to lower IQ in children. At the level used in US community water, the evidence is uncertain and points both ways.
Consistent
Children's IQ, at higher levels
18of 19high-quality studies found lower IQ with more fluoride, in a federal review 23
The National Toxicology Program concluded, with moderate confidence, that fluoride above 1.5 mg/L in drinking water is linked to lower IQ in children 23. A companion meta-analysis of 74 studies found IQ 1.63 points lower for each 1 mg/L more fluoride in children's urine 106.
Pregnancy and infancy look like sensitive windows. In Mexico and Canada, more fluoride in mothers' urine during pregnancy predicted lower IQ in their children 10724. Among formula-fed babies in Canada, each 0.5 mg/L more fluoride in tap water was associated with 9.3 points lower performance IQ 108.
Key studies5 studies
23National Toxicology Program (2024)NTP MonographPaper ↗Moderate confidence that higher fluoride exposures (e.g. drinking water above 1.5 mg/L) are associated with lower child IQ; 18 of 19 high-quality studies reported inverse associations. Insufficient data for 0.7 mg/L.Systematic review, 72 IQ studies (19 high quality).
106Taylor et al. (2025)JAMA PediatrPaper ↗Pooled SMD -0.45; 1.63 IQ points lower per 1 mg/L increase in urinary fluoride (1.14 in low risk-of-bias studies). Association was null for water fluoride <1.5 mg/L overall but stayed inverse in low risk-of-bias studies.Meta-analysis of 74 studies (NIEHS/NTP authors). Limits: Most studies were cross-sectional, many high risk of bias; urinary fluoride and water fluoride concentrations are not interchangeable.
24Green et al. (2019)JAMA PediatrPaper ↗1 mg/L higher maternal urinary fluoride was associated with 4.49 lower IQ in boys (no significant effect in girls); 1 mg/day higher maternal intake with 3.66 lower IQ in all children.MIREC birth cohort, n=512. Limits: Observational, possible residual confounding, sex-specific results.
107Bashash et al. (2017)Environ Health PerspectPaper ↗A 0.5 mg/L increase in maternal urinary fluoride predicted 3.15 lower GCI at age 4 and 2.50 lower IQ at 6 to 12.ELEMENT birth cohort, n=299 mother-child pairs.
108Till et al. (2020)Environ IntPaper ↗A 0.5 mg/L increase in water fluoride corresponded to 9.3 lower Performance IQ in formula-fed and 6.2 lower in breastfed children.MIREC cohort, n=398.
Counterpoints. Most of the studies were cross-sectional, many had a high risk of bias, and fluoride in urine isn't the same measure as fluoride in water 106.
Unsettled
Children's IQ, at the US level
0.7mg/Lthe level recommended for US community water, where a federal review found too little data to judge 23
At 0.7 mg/L, the National Toxicology Program found too little data to judge 23. The meta-analysis found no overall link below 1.5 mg/L, though the link stayed inverse in the most rigorous studies 106. In a Canadian birth cohort across six cities, more fluoride in mothers' urine during pregnancy was associated with lower IQ in boys 24.
Two 2025 cohorts found no harm at community levels. Australians exposed in early childhood didn't have lower IQ as young adults 25, and in a US cohort followed to about age 60, recommended-range fluoride was associated with slightly better cognition as teenagers 26.
Points to a risk
Studies3 studies
24Green et al. (2019)JAMA PediatrPaper ↗1 mg/L higher maternal urinary fluoride was associated with 4.49 lower IQ in boys (no significant effect in girls); 1 mg/day higher maternal intake with 3.66 lower IQ in all children.MIREC birth cohort, n=512. Limits: Observational, possible residual confounding, sex-specific results.
108Till et al. (2020)Environ IntPaper ↗A 0.5 mg/L increase in water fluoride corresponded to 9.3 lower Performance IQ in formula-fed and 6.2 lower in breastfed children.MIREC cohort, n=398.
109Grandjean et al. (2022)Risk AnalPaper ↗Benchmark concentration level of about 0.2 mg/L maternal urinary fluoride for a 1-point IQ loss, with no deviation from linearity.Benchmark dose modeling of ELEMENT and MIREC cohorts.
Points the other way
Studies2 studies
25Do et al. (2025)J Dent ResPaper ↗Early-childhood fluoridated-water exposure and dental fluorosis were not associated with lower later IQ.Population-based longitudinal follow-up; 357 Australians aged 16–26. Limits: Modest follow-up sample and reconstructed exposure; focuses on childhood exposure rather than directly measuring pregnancy fluoride.
26Warren et al. (2025)Sci AdvPaper ↗Recommended-range adolescent water fluoride was associated with modestly better adolescent cognition; the midlife difference was not statistically significant.Longitudinal national US cohort; High School and Beyond cohort followed into approximately age 60. Limits: Observational; exposure was measured in adolescence, not in pregnancy or infancy.
Counterpoints. There are no trials, and none of these studies sets a safe or harmful level for tap water. The two reassuring cohorts measured childhood exposure, so they can't settle the question for pregnancy 2526.
Consistent
Teeth and fluorosis
12%of people have dental fluorosis that's aesthetically concerning at 0.7 mg/L 27
Since fluoride toothpaste became common, the benefit to teeth has been small. A Cochrane review found that fluoridation may prevent about a quarter of a decayed baby tooth per child, with low certainty 27.
Fluoride can also cause dental fluorosis. At 0.7 mg/L, about 12% of people have fluorosis that's aesthetically concerning 27, and in US children aged 6 to 15, some degree of fluorosis was found in 68% to 87% 110.
Key studies2 studies
27Iheozor-Ejiofor et al. (2024)Cochrane Database Syst RevPaper ↗Post-1975 evidence shows fluoridation initiation may reduce decayed/missing/filled baby teeth by about one quarter of a tooth (low certainty, CI includes no benefit); at 0.7 ppm about 12% have aesthetically concerning fluorosis.Cochrane review, 157 non-randomized studies. Limits: Contemporary caries evidence was low certainty; the fluorosis evidence was carried forward rather than newly updated.
110Hung et al. (2023)JAMA Netw OpenPaper ↗87.3% (2013 to 2014) and 68.2% (2015 to 2016) showed some degree of fluorosis; higher water and plasma fluoride raised odds.NHANES 2013 to 2016, children 6 to 15, n≈3,000.
Counterpoints. Mild fluorosis is cosmetic. And the Cochrane review carried its fluorosis evidence forward from earlier work rather than updating it 27.
What we suggest
Careful with fluoride. We think the current health benchmark for fluoride is set too high. That's a precautionary call, not a settled finding. Keep fluoride low, especially during pregnancy and in the water you use for infant formula 108. Carbon filters aren't certified for fluoride; reverse osmosis systems can be 40.
Our approach
We test what you drink, and what you bathe in.
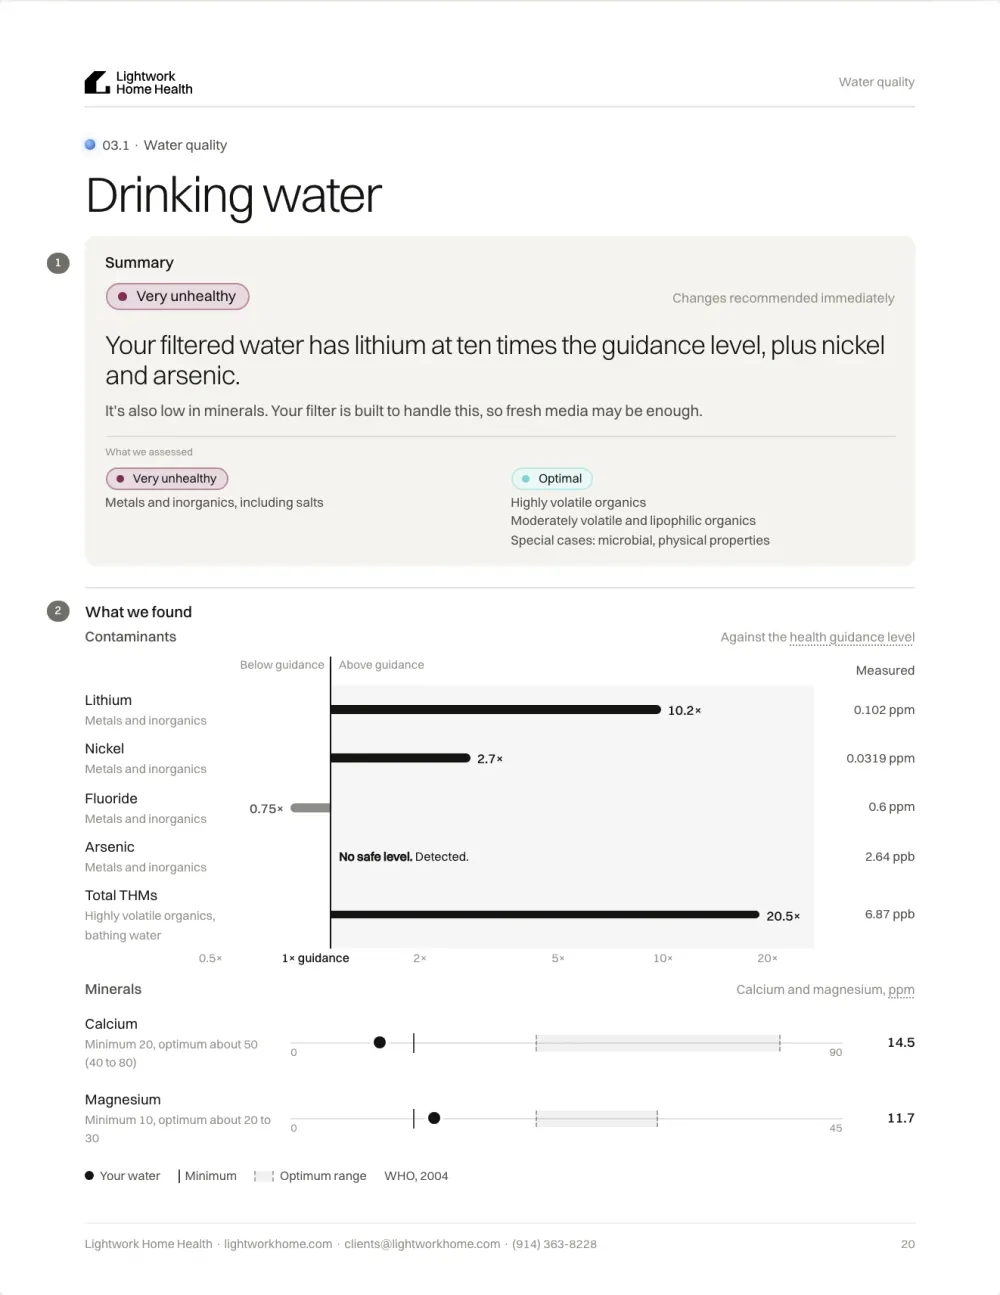
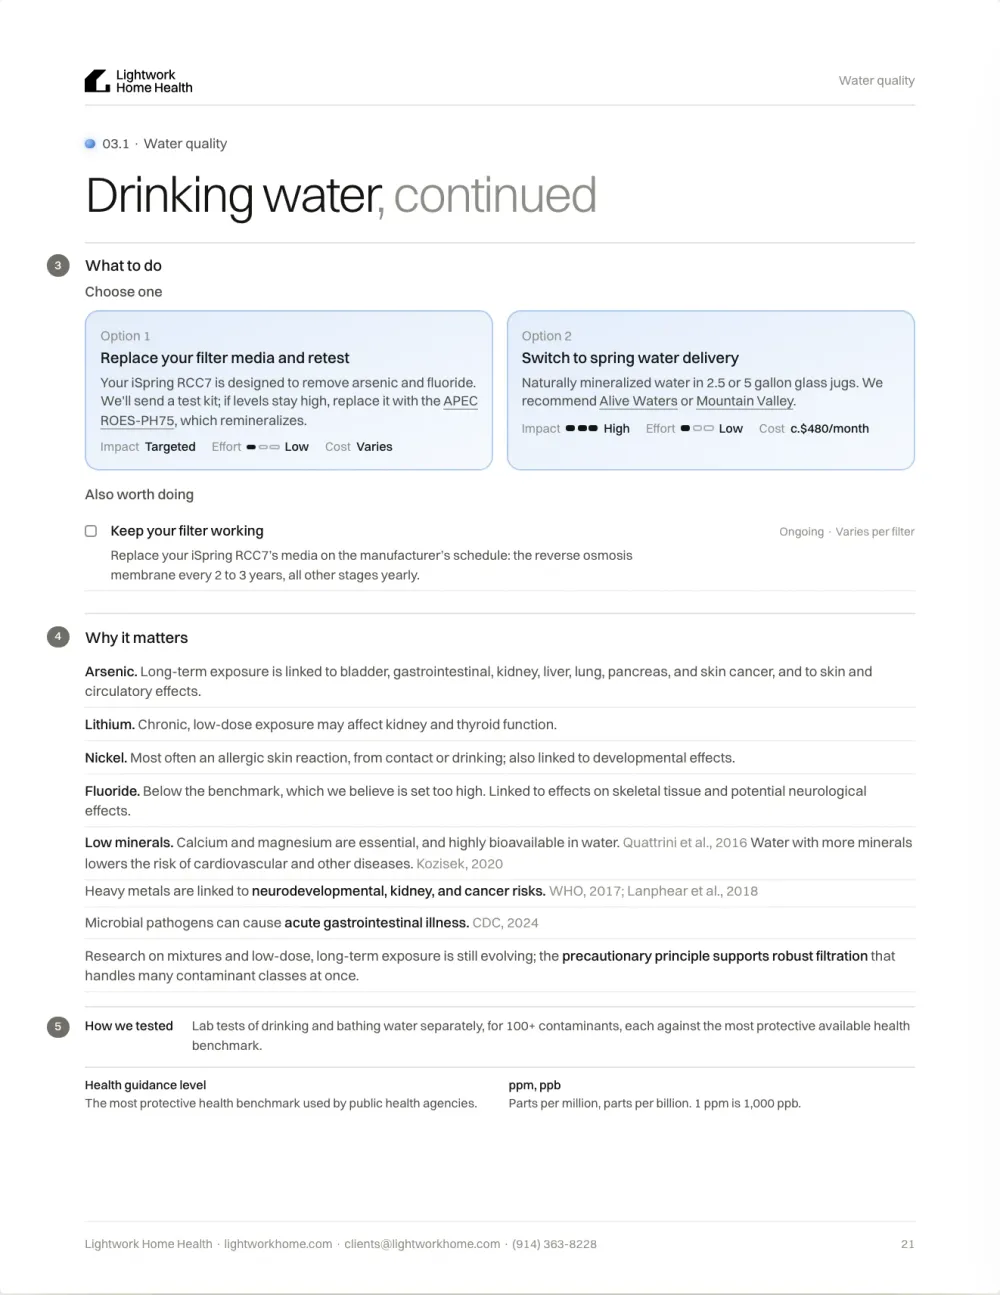
Water can look, smell, and taste fine and still carry things you'd never choose to drink. A filter can be the wrong type, installed in the wrong place, or worn out. So we lab test your water for more than 100 contaminants, at your main drinking tap, your main shower, and a tap before any filter.
92%
of the last 50 homes we tested had water contaminants above health guidance levels.
1 in 5
homes already had a filtration system that was installed incorrectly or wasn't removing what it claimed to.
100+
contaminants in every lab test, from metals and minerals to volatile organics.
Lightwork measurements.
What we measure
Six groups of readings.
What you mostly drink
Metals and inorganics
Lead, arsenic, uranium, lithium, nickel, fluoride, nitrate, and salts. These matter in drinking water, since they barely evaporate or cross the skin.
What you mostly breathe
Highly volatile organics
THMs and other compounds that escape into shower air. These matter most in bathing water.
Every route
Moderately volatile organics
Compounds, including lipophilic ones, that reach you through skin and breath and by drinking. These matter in both.
Special cases
Microbes and physical properties
Bacteria, and properties of the water itself, in your drinking water.
What you want to keep
Minerals
How much calcium and magnesium your water has.
On site
Screening tests
TDS and quick strip tests at several taps, to find any that differ before we choose where to sample.
How a visit works
We sample the right taps and make a plan
Choose the taps
A tap before any filter, like an outdoor hose bib, as a baseline for what the utility sends in, plus your main drinking tap and main shower.
Screen on site
Quick TDS and strip tests show whether any taps differ widely, which can change where we sample.
Lab test
More than 100 contaminants, from metals and minerals to volatile organics.
Sort by route
Each contaminant is assigned to drinking water, bathing water, or both, depending on how it reaches you.
Give you a plan
Whether your filter is working, what to change, and exactly what to buy, with a retest when it matters.
What you get
Your results, contaminant by contaminant, in your Lightwork report.
Find out what's in your water.
We test your drinking and bathing water, check that your filters are doing their job, and give you a short list of changes, along with everything else we test in your home.
1Jo et al. (1990). Routes of chloroform exposure and body burden from showering with chlorinated tap water. Risk Analysis. Comparison of normal showers vs inhalation-only shower exposure.. Paper ↗
2Backer et al. (2000). Household exposures to drinking water disinfection by-products: whole blood trihalomethane levels. J Expo Anal Environ Epidemiol. Controlled human exposure, 31 adults (10-min shower, 10-min bath, or drinking 1 L).. Paper ↗
3Medgyesi et al. (2024). Long-Term Exposure to Arsenic in Community Water Supplies and Risk of Cardiovascular Disease among Women in the California Teachers Study. Environ Health Perspect. Prospective cohort, n=98,250 women, 1995 to 2018. Paper ↗
4Medgyesi et al. (2025). Long-Term Exposure to Uranium and Arsenic in Community Drinking Water and CKD Risk Among California Women. Am J Kidney Dis. California Teachers Study cohort, n=88,185. Paper ↗
5Helte et al. (2025). Exposure to Drinking Water Trihalomethanes and Risk of Cancer: A Systematic Review of the Epidemiologic Evidence and Dose-Response Meta-Analysis. Environmental Health Perspectives. PROSPERO-registered systematic review and dose-response meta-analysis; 29 publications, 14 cancers; bladder (5,860 cases) and colorectal (9,262 cases) pooled.. Paper ↗
6Smalling et al. (2023). Per- and polyfluoroalkyl substances (PFAS) in United States tapwater: Comparison of underserved private-well and public-supply exposures and associated health implications. Environment International. USGS national survey of tap water at 716 locations (269 private wells, 447 public supply), 2016-2021.. Paper ↗
7Lanphear et al. (2005). Low-level environmental lead exposure and children's intellectual function: an international pooled analysis. Environ Health Perspect. Pooled analysis of 7 prospective cohorts, n=1,333 children. Paper ↗
8Araya et al. (2004). Community-based randomized double-blind study of gastrointestinal effects and copper exposure in drinking water. Environ Health Perspect. Randomized double-blind trial, n=1,365 adults, 2 months. Paper ↗
9Liew et al. (2023). Association Between Estimated Geocoded Residential Maternal Exposure to Lithium in Drinking Water and Risk for Autism Spectrum Disorder in Offspring in Denmark. JAMA Pediatr. Nationwide case-control, 8,842 ASD cases and 43,864 controls. Paper ↗
10Memon et al. (2020). Association between naturally occurring lithium in drinking water and suicide rates: systematic review and meta-analysis of ecological studies. Br J Psychiatry. Meta-analysis of 15 ecological studies. Paper ↗
11Catling et al. (2008). A systematic review of analytical observational studies investigating the association between cardiovascular disease and drinking water hardness. J Water Health. Systematic review, 14 studies (9 case-control, 5 cohort). Paper ↗
12Jabbar-Lopez et al. (2021). The effect of water hardness on atopic eczema, skin barrier function: A systematic review, meta-analysis. Clin Exp Allergy. Systematic review and meta-analysis; 16 studies; seven observational studies included 385,901 participants. Paper ↗
13Thomas et al. (2011). A randomised controlled trial of ion-exchange water softeners for the treatment of eczema in children. PLoS Med. Observer-blind randomized controlled trial; 336 children with moderate/severe eczema. Paper ↗
14Grazuleviciene et al. (2011). Individual exposures to drinking water trihalomethanes, low birth weight and small for gestational age risk: a prospective Kaunas cohort study. Environmental Health. Prospective cohort of 4,161 pregnant women, internal THM dose from drinking, showering, and bathing.. Paper ↗
15Grellier et al. (2010). Exposure to disinfection by-products, fetal growth, and prematurity: a systematic review and meta-analysis. Epidemiology. Paper ↗
16Grandjean et al. (2012). Serum vaccine antibody concentrations in children exposed to perfluorinated compounds. JAMA. Faroe Islands birth cohort, 587 children followed to age 7.. Paper ↗
17Shearer et al. (2021). Serum Concentrations of Per- and Polyfluoroalkyl Substances and Risk of Renal Cell Carcinoma. J Natl Cancer Inst. Nested case-control within PLCO trial, 324 cases and 324 matched controls, prediagnostic serum.. Paper ↗
18Rhee et al. (2023). Serum concentrations of per- and polyfluoroalkyl substances and risk of renal cell carcinoma in the Multiethnic Cohort Study. Environ Int. Paper ↗
19Sherris et al. (2021). Nitrate in Drinking Water during Pregnancy and Spontaneous Preterm Birth: A Retrospective Within-Mother Analysis in California. Environ Health Perspect. Within-mother sibling design, 1.44 million births. Paper ↗
20Schullehner et al. (2018). Nitrate in drinking water and colorectal cancer risk: A nationwide population-based cohort study. Int J Cancer. Danish nationwide cohort, 2.7 million adults, 23 million person-years. Paper ↗
21Picetti et al. (2022). Nitrate and nitrite contamination in drinking water and cancer risk: A systematic review with meta-analysis. Environ Res. Systematic review, 60 cancer studies. Paper ↗
22Goldman et al. (2023). Risk of Parkinson Disease Among Service Members at Marine Corps Base Camp Lejeune. JAMA Neurology. Cohort of 158,122 veterans with health data (Camp Lejeune vs uncontaminated Camp Pendleton).. Paper ↗
23National Toxicology Program (2024). NTP Monograph on the State of the Science Concerning Fluoride Exposure and Neurodevelopment and Cognition: A Systematic Review. NTP Monograph. Systematic review, 72 IQ studies (19 high quality). Paper ↗
24Green et al. (2019). Association Between Maternal Fluoride Exposure During Pregnancy and IQ Scores in Offspring in Canada. JAMA Pediatr. MIREC birth cohort, n=512. Paper ↗
25Do et al. (2025). Early Childhood Exposures to Fluorides and Cognitive Neurodevelopment: A Population-Based Longitudinal Study. J Dent Res. Population-based longitudinal follow-up; 357 Australians aged 16–26. Paper ↗
26Warren et al. (2025). Childhood fluoride exposure and cognition across the life course. Sci Adv. Longitudinal national US cohort; High School and Beyond cohort followed into approximately age 60. Paper ↗
27Iheozor-Ejiofor et al. (2024). Water fluoridation for the prevention of dental caries. Cochrane Database Syst Rev. Cochrane review, 157 non-randomized studies. Paper ↗
28Xu et al. (2002). Percutaneous absorption of trihalomethanes, haloacetic acids, and haloketones. Toxicology and Applied Pharmacology. In vitro human skin diffusion chambers.. Paper ↗
29Weisel & Jo (1996). Ingestion, inhalation, and dermal exposures to chloroform and trichloroethene from tap water. Environmental Health Perspectives. Human breath time-series by exposure route.. Paper ↗
30Backer et al. (2008). Exogenous and endogenous determinants of blood trihalomethane levels after showering. Environmental Health Perspectives. 100 participants, controlled 10-min shower, blood THM before and after.. Paper ↗
31Gordon et al. (2006). Changes in breath trihalomethane levels resulting from household water-use activities. Environmental Health Perspectives. 7 subjects, 12 household water-use activities in 2 residences.. Paper ↗
32Xu & Weisel (2005). Dermal uptake of chloroform and haloketones during bathing. J Expo Anal Environ Epidemiol. 6 human subjects, 30-min bath with breath sampling.. Paper ↗
33Nuckols et al. (2005). Influence of tap water quality and household water use activities on indoor air and internal dose levels of trihalomethanes. Environmental Health Perspectives. Controlled residential exposure study of 14 household water-use activities in 2 homes.. Paper ↗
34US EPA (2024). PFAS National Primary Drinking Water Regulation. Federal regulation. Federal regulation.. Paper ↗
35Allen et al. (2022). Drivers of Disinfection Byproduct Cytotoxicity in U.S. Drinking Water: Should Other DBPs Be Considered for Regulation?. Environ Sci Technol. Laboratory study of drinking waters from across the US: cell toxicity tests alongside measurements of over 70 regulated and unregulated disinfection byproducts. Paper ↗
36Ochoa-Acuña et al. (2009). Drinking-water herbicide exposure in Indiana and prevalence of small-for-gestational-age and preterm delivery. Environmental Health Perspectives. Retrospective cohort, 24,154 births, 19 water systems.. Paper ↗
37Helte et al. (2023). Disinfection by-products in drinking water and risk of colorectal cancer: a population-based cohort study. J Natl Cancer Inst. Two Swedish population-based cohorts, n=58,672, mean follow-up 16.8 years, 1,913 cases.. Paper ↗
38Wasserman et al. (2014). A cross-sectional study of well water arsenic and child IQ in Maine schoolchildren. Environ Health. Cross-sectional, n=272 US children. Paper ↗
39Herkert et al. (2020). Assessing the effectiveness of point-of-use residential drinking water filters for perfluoroalkyl substances (PFASs). Environ Sci Technol Lett. Field study of home filters in 73 North Carolina homes, measuring 16 PFAS before and after the filter. Paper ↗
40NSF (2026). Certified drinking water treatment units: reduction claims by NSF/ANSI standard. NSF certification listings. Certification database, read November 2026. Paper ↗
41Minnesota Department of Health (2024). Home Water Treatment. State health department guide. Fact sheet, revised March 2024. Paper ↗
42CDC (2024). About Choosing Home Water Filters. CDC. Agency consumer guidance. Paper ↗
43US EPA (2024). Consumer Tool for Identifying Point-of-Use and Pitcher Filters Certified to Reduce Lead in Drinking Water. US EPA. Agency consumer guidance (EPA/600/F-24/143). Paper ↗
44US EPA (2018). Reducing PFAS in Drinking Water with Treatment Technologies. US EPA. Agency research summary, updated February 2026. Paper ↗
45Goodlad et al. (2013). Lead and Attention-Deficit/Hyperactivity Disorder (ADHD) symptoms: a meta-analysis. Clin Psychol Rev. Meta-analysis of 33 studies, n=10,232 children and adolescents. Paper ↗
46Hanna-Attisha et al. (2016). Elevated Blood Lead Levels in Children Associated With the Flint Drinking Water Crisis. Am J Public Health. Pre/post spatial analysis of blood lead in children under 5. Paper ↗
47Tornero-Velez et al. (2025). Strong Association between Children's Elevated Blood Lead Levels and Lead Service Lines: A Census Tract-Level Analysis for Two Midwest Cities. Environ Sci Technol. EPA census tract analysis, Cincinnati and Grand Rapids. Paper ↗
48Lanphear et al. (2018). Low-level lead exposure and mortality in US adults: a population-based cohort study. Lancet Public Health. NHANES III cohort, n=14,289, median 19.3 years follow-up. Paper ↗
49Navas-Acien et al. (2007). Lead exposure and cardiovascular disease: a systematic review. Environ Health Perspect. Systematic review of observational studies. Paper ↗
50McFarland et al. (2022). Half of US population exposed to adverse lead levels in early childhood. PNAS. Population modeling of US birth cohorts 1940 to 2015. Paper ↗
51Trejo et al. (2024). The Effects of the Flint water crisis on the educational outcomes of school-age children. Sci Adv. Synthetic control analysis of Michigan administrative education data. Paper ↗
52Nawrot et al. (2002). An epidemiological re-appraisal of the association between blood pressure and blood lead: a meta-analysis. J Hum Hypertens. Meta-analysis of 31 studies, n=58,518. Paper ↗
53Spaur et al. (2024). Association of Water Arsenic With Incident Diabetes in U.S. Adults: MESA and the Strong Heart Study. Diabetes Care. Two prospective cohorts, n=7,568. Paper ↗
54Wu et al. (2025). Arsenic Exposure Reduction and Chronic Disease Mortality. JAMA. HEALS prospective cohort, n=10,977, Bangladesh, mortality through 2022. Paper ↗
55Smith et al. (2018). Lung, Bladder, and Kidney Cancer Mortality 40 Years After Arsenic Exposure Reduction. J Natl Cancer Inst. Population mortality study, Antofagasta, Chile natural experiment. Paper ↗
56Moon et al. (2013). Association between exposure to low to moderate arsenic levels and incident cardiovascular disease. A prospective cohort study. Ann Intern Med. Strong Heart Study cohort, n=3,575 American Indian adults, follow-up to 2008. Paper ↗
57Argos et al. (2010). Arsenic exposure from drinking water, and all-cause and chronic-disease mortalities in Bangladesh (HEALS). Lancet. Prospective cohort, n=11,746. Paper ↗
58Boffetta & Borron (2019). Low-Level Exposure to Arsenic in Drinking Water and Risk of Lung and Bladder Cancer. Dose Response. Paper ↗
59Boffetta et al. (2026). Low-level exposure to arsenic in drinking water and risk of type 2 diabetes: a systematic review and meta-analysis. Eur J Epidemiol. Systematic review and dose-response meta-analysis; 11 studies, 12 populations. Paper ↗
60Deng et al. (2026). Environmental Nonessential Element Exposure and Urologic Cancer: A Systematic Review and Meta-Analysis. JAMA Netw Open. Meta-analysis of 62 studies. Paper ↗
61Ravalli et al. (2022). Sociodemographic inequalities in uranium and other metals in community water systems across the USA, 2006-11. Lancet Planet Health. Cross-sectional, 37,915 community water systems. Paper ↗
62Spaur et al. (2024). Contribution of arsenic and uranium in private wells and community water systems to urinary biomarkers in US adults. J Expo Sci Environ Epidemiol. SHFS and MESA, up to 6,722 participants. Paper ↗
63Martinez-Morata et al. (2024). Association of Urinary Metals With Cardiovascular Disease Incidence and All-Cause Mortality in MESA. Circulation. MESA cohort, n=6,599, follow-up to 2019. Paper ↗
64Spaur et al. (2026). Drinking water and urinary uranium and incident diabetes: MESA and Strong Heart Family Study. Environ Res. Paper ↗
65Araya et al. (2001). Determination of an acute no-observed-adverse-effect level (NOAEL) for copper in water. Regul Toxicol Pharmacol. Double-blind controlled multi-site trial, n=179. Paper ↗
66Jensen et al. (2006). Systemic contact dermatitis after oral exposure to nickel: a review with a modified meta-analysis. Contact Dermatitis. Meta-analysis of 9 provocation studies. Paper ↗
67Harari et al. (2015). Exposure to Lithium and Cesium Through Drinking Water and Thyroid Function During Pregnancy. Thyroid. Prospective mother-child cohort, n=194, Argentinean Andes. Paper ↗
68Kessing et al. (2017). Association of Lithium in Drinking Water With the Incidence of Dementia. JAMA Psychiatry. Danish nested case-control, 73,731 dementia cases and 733,653 controls. Paper ↗
69Eyre-Watt et al. (2021). The association between lithium in drinking water and neuropsychiatric outcomes: A systematic review and meta-analysis from across 2678 regions containing 113 million people. Aust N Z J Psychiatry. Meta-analysis, 27 studies, 113 million people. Paper ↗
70Edwards (2014). Fetal death and reduced birth rates associated with exposure to lead-contaminated drinking water. Environ Sci Technol. Ecological study of the Washington DC lead crisis (2000 to 2004). Paper ↗
71Quattrini et al. (2016). Natural mineral waters: chemical characteristics and health effects. Clin Cases Miner Bone Metab. Narrative review. Paper ↗
72Jiang et al. (2016). Magnesium Levels in Drinking Water and Coronary Heart Disease Mortality Risk: A Meta-Analysis. Nutrients. Meta-analysis, 10 studies, 77,821 CHD cases. Paper ↗
73Kousa et al. (2006). Calcium:magnesium ratio in local groundwater and incidence of acute myocardial infarction among males in rural Finland. Environ Health Perspect. Small-area Bayesian study, 14,495 first AMIs. Paper ↗
74Shlezinger et al. (2018). Association between exposure to desalinated sea water and ischemic heart disease, diabetes mellitus and colorectal cancer; A population-based study in Israel. Environ Res. Population-based historical cohort (Clalit), 2004 to 2013. Paper ↗
75WHO, eds. Cotruvo and Bartram (2009). Calcium and magnesium in drinking-water: public health significance. Expert meeting report (guideline context). WHO expert meeting report (eds. Cotruvo and Bartram). Paper ↗
76Kozisek (2020). Regulations for calcium, magnesium or hardness in drinking water in the European Union member states. Regul Toxicol Pharmacol. Regulatory review, 28 EU countries. Paper ↗
77Rapant et al. (2021). Differences in health status of Slovak municipalities supplied with drinking water of different hardness values. Environ Geochem Health. Ecological, 53 municipalities, 15-year averages. Paper ↗
78Gianfredi et al. (2017). Cardiovascular diseases and hard drinking waters: implications from a systematic review with meta-analysis of case-control studies. J Water Health. Systematic review and meta-analysis of case-control studies; Seven studies, approximately 44,000 participants. Paper ↗
79Perkin et al. (2016). Association between domestic water hardness, chlorine, and atopic dermatitis risk in early life: A population-based cross-sectional study. J Allergy Clin Immunol. Population-based cross-sectional study; 1,303 three-month-old infants. Paper ↗
80Danby et al. (2018). The Effect of Water Hardness on Surfactant Deposition after Washing and Subsequent Skin Irritation in Atopic Dermatitis Patients and Healthy Control Subjects. J Invest Dermatol. Controlled skin-washing experiment; 80 participants with/without eczema and FLG mutations. Paper ↗
81Jabbar-Lopez et al. (2022). Randomized controlled pilot trial with ion-exchange water softeners to prevent eczema (SOFTER trial). Clin Exp Allergy. Assessor-blinded pilot randomized trial; 80 families randomized; 78 remained after initial withdrawals. Paper ↗
82WHO (2005). Nutrients in drinking-water. Expert meeting report, with Kozisek, "Health risks from drinking demineralised water". WHO expert meeting report (Rome 2003). Paper ↗
83Villanueva et al. (2004). Disinfection byproducts and bladder cancer: a pooled analysis. Epidemiology. Pooled analysis of 6 case-control studies (US, Canada, France, Italy, Finland); 2,806 cases, 5,254 controls.. Paper ↗
84Evlampidou et al. (2020). Trihalomethanes in Drinking Water and Bladder Cancer Burden in the European Union. Environmental Health Perspectives. Burden-of-disease analysis using THM monitoring data from 26 EU countries (75% of population) and a pooled exposure-response function.. Paper ↗
85Villanueva et al. (2007). Bladder cancer and exposure to water disinfection by-products through ingestion, bathing, showering, and swimming in pools. American Journal of Epidemiology. Case-control study in Spain, 1,219 cases and 1,271 controls, lifetime water-use histories.. Paper ↗
86Costet et al. (2011). Water disinfection by-products and bladder cancer: is there a European specificity? A pooled and meta-analysis of European case-control studies. Occup Environ Med. Pooled and meta-analysis of 3 European case-control studies (2,381 cases, 3,086 controls).. Paper ↗
87Donat-Vargas et al. (2023). Long-Term Exposure to Nitrate and Trihalomethanes in Drinking Water and Prostate Cancer: A Multicase-Control Study in Spain (MCC-Spain). Environ Health Perspect. Paper ↗
88Summerhayes et al. (2021). Meta-analysis of small for gestational age births and disinfection byproduct exposures. Environmental Research. Meta-analysis of 19 study populations from 16 publications.. Paper ↗
89Rivera-Núñez et al. (2018). Exposure to disinfectant by-products and the risk of stillbirth in Massachusetts. Occup Environ Med. Case-control study of 2,460 stillbirths with 10 controls each.. Paper ↗
90Villanueva et al. (2011). Exposure to trihalomethanes through different water uses and birth weight, small for gestational age, and preterm delivery in Spain. Environ Health Perspect. Paper ↗
91Säve-Söderbergh et al. (2020). Exposure to Drinking Water Chlorination by-Products and Fetal Growth and Prematurity: A Nationwide Register-Based Prospective Study. Environmental Health Perspectives. Swedish nationwide register study, about 500,000 births.. Paper ↗
92Grandjean et al. (2017). Serum Vaccine Antibody Concentrations in Adolescents Exposed to Perfluorinated Compounds. Environmental Health Perspectives. Follow-up of Faroese cohort at age 13, n=516.. Paper ↗
93Liu et al. (2023). Associations between Per- and Polyfluoroalkyl Substances Exposures and Blood Lipid Levels among Adults: A Meta-Analysis. Environmental Health Perspectives. Meta-analysis of 29 publications.. Paper ↗
94NASEM (2022). Guidance on PFAS Exposure, Testing, and Clinical Follow-Up. National Academies consensus report. Consensus report.. Paper ↗
95Costello et al. (2022). Exposure to per- and Polyfluoroalkyl Substances and Markers of Liver Injury: A Systematic Review and Meta-Analysis. Environmental Health Perspectives. Systematic review of 85 rodent and 24 human studies with meta-analysis.. Paper ↗
96Steenland et al. (2018). Serum Perfluorooctanoic Acid and Birthweight: An Updated Meta-analysis With Bias Analysis. Epidemiology. Meta-analysis of 24 studies.. Paper ↗
97IARC (Zahm et al.) (2023). Carcinogenicity of perfluorooctanoic acid and perfluorooctanesulfonic acid. Lancet Oncol. IARC Monographs Volume 135 expert evaluation.. Paper ↗
98Barry et al. (2013). Perfluorooctanoic acid (PFOA) exposures and incident cancers among adults living near a chemical plant. Environmental Health Perspectives. C8 Health Project cohort, n=32,254 Mid-Ohio Valley residents exposed via drinking water.. Paper ↗
99US EPA (2025). Identifying Drinking Water Filters Certified to Reduce PFAS. US EPA. Agency consumer guidance, updated November 2025. Paper ↗
100US EPA (2026). Private Drinking Water Wells. US EPA. Agency web page, updated November 2026. Paper ↗
101Tokranov et al. (2024). Predictions of groundwater PFAS occurrence at drinking water supply depths in the United States. Science. USGS machine-learning model of groundwater PFAS.. Paper ↗
102Ward et al. (2018). Drinking Water Nitrate and Human Health: An Updated Review. Int J Environ Res Public Health. Narrative review of 30+ studies since 2005 (NCI authors). Paper ↗
103Christensen et al. (2026). Systematic review of adverse human health effects following oral exposure to inorganic nitrate and nitrite. J Toxicol Environ Health B. EPA systematic review, 267 human studies. Paper ↗
104Ghorbani Nejad et al. (2024). Exposure to atrazine by drinking water and the increased risk of neonatal complications in consequence: a meta-analysis. Int J Environ Health Res. Meta-analysis of 5 studies.. Paper ↗
105Bove et al. (2024). Cancer Incidence among Marines and Navy Personnel and Civilian Workers Exposed to Industrial Solvents in Drinking Water at US Marine Corps Base Camp Lejeune: A Cohort Study. Environmental Health Perspectives. ATSDR cohort, about 155,000 Camp Lejeune vs 163,000 Camp Pendleton personnel plus civilian workers, registry-linked 1996-2017.. Paper ↗
106Taylor et al. (2025). Fluoride Exposure and Children's IQ Scores: A Systematic Review and Meta-Analysis. JAMA Pediatr. Meta-analysis of 74 studies (NIEHS/NTP authors). Paper ↗
107Bashash et al. (2017). Prenatal Fluoride Exposure and Cognitive Outcomes in Children at 4 and 6-12 Years of Age in Mexico. Environ Health Perspect. ELEMENT birth cohort, n=299 mother-child pairs. Paper ↗
108Till et al. (2020). Fluoride exposure from infant formula and child IQ in a Canadian birth cohort. Environ Int. MIREC cohort, n=398. Paper ↗
109Grandjean et al. (2022). A Benchmark Dose Analysis for Maternal Pregnancy Urine-Fluoride and IQ in Children. Risk Anal. Benchmark dose modeling of ELEMENT and MIREC cohorts. Paper ↗
110Hung et al. (2023). A National Study Exploring the Association Between Fluoride Levels and Dental Fluorosis. JAMA Netw Open. NHANES 2013 to 2016, children 6 to 15, n≈3,000. Paper ↗
Find out what's in your water.
We test your drinking and bathing water, check that your filters are doing their job, and give you a short list of changes, along with everything else we test in your home.









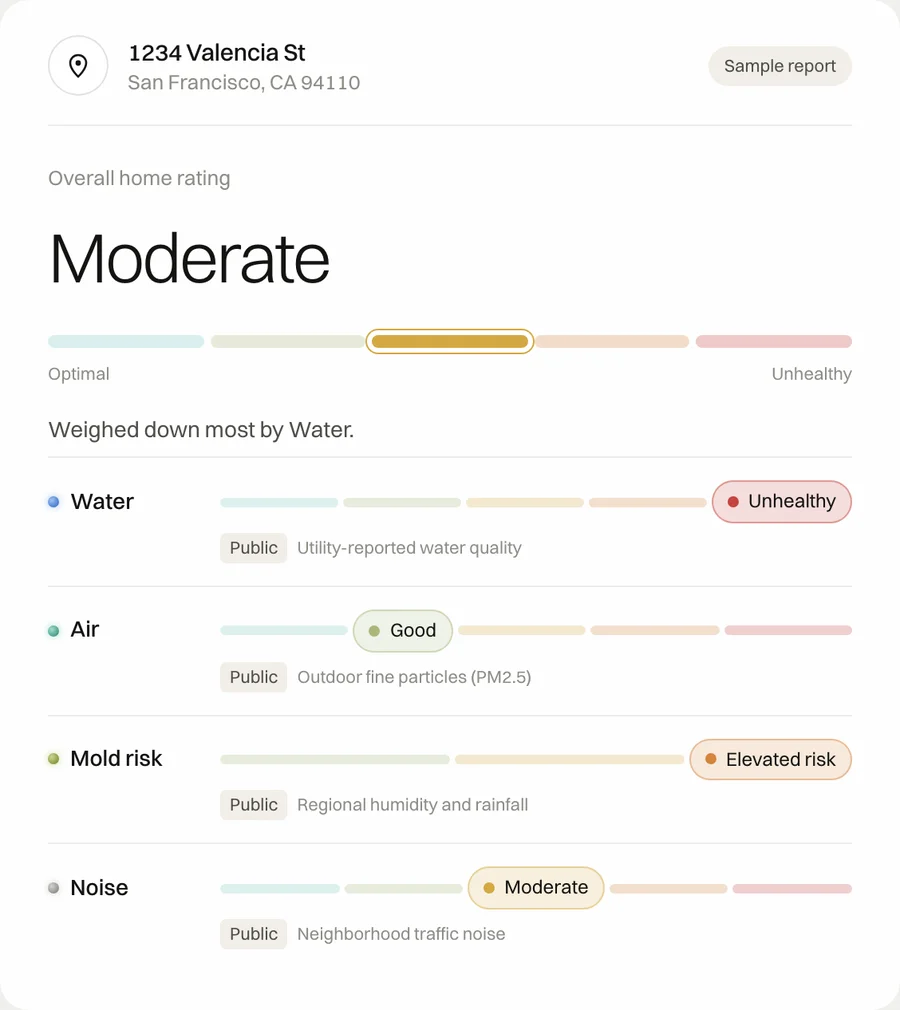 Get your free personalized home report.