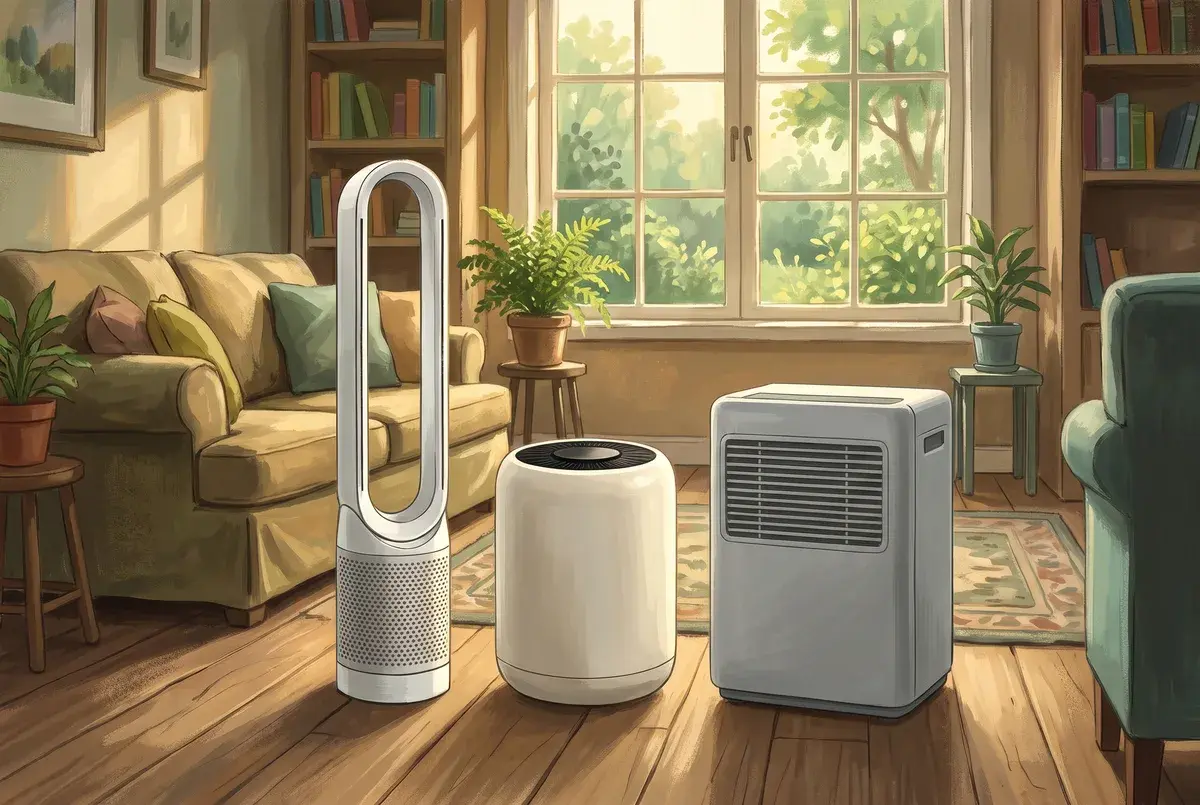
You can choose what you eat and drink, but you breathe whatever air is in the room. That makes indoor air one of the exposures we care most about, and luckily, often one of the easiest to improve.
This page starts with how indoor air works, then goes through the research on the health effects of six kinds of air-related exposures, and wraps up with how we test the air in your home.
Some of the air inside your home leaks in from outside, and the rest is made inside: by the stove, candles, gas appliances, the new sofa, cleaning sprays, and you and your family.
In 3,977 US homes, 48% of fine particles came from indoor sources like cooking 1, and often chemical vapor levels are higher inside than out, even in an empty house 2.
We sort air into six exposures; here are some health effects each is linked to, along with the strength of the evidence.
Exposure 1 · Every room
Particles
Tiny bits of dust, smoke, and soot floating in the air. About half come in from outside; the rest are made indoors, often by cooking.
We suggestFilter the air in the rooms you use most, and use a range hood or purifier to catch cooking smoke.
49%higher risk of new asthma symptoms with weekly cleaning-spray use, in 3,503 adults 15, but a review of 53 studies called the evidence poor and inconsistent 16
In some cases, the evidence is cut-and-dried, and eliminating a negative exposure or adding a positive one is an obvious choice.
But most situations aren't like that. For those, we believe in the Precautionary Principle. When there's credible signal of risk, the source is in your home, and the fix is simple, our preference is to act early and preventatively instead of waiting for complete scientific consensus. This is especially true if you suspect you might be feeling negative effects that could be caused by a prospective exposure. “No (or uncertain) evidence of harm” is not the same as “evidence of no harm” or “evidence of safety.”
We also believe there's a big gap between the higher certainty required to make changes at a societal level, and the low certainty required to make a simple change yourself and see how you feel, and we're focused on the latter.
And of course, this is all subject to change as the science continues to evolve.
Settled Shown in trials. Randomized trials in people show the effect, and reviews agree.
Consistent Large studies agree. Big studies and pooled analyses point the same way, but trials are small or not possible.
Emerging Early, and growing. Newer or smaller studies agree, and the finding needs to be replicated.
Unsettled Evidence is split. Different kinds of studies disagree, so we make sure to consider and show both sides.
How it works
The basics of indoor air
Four key indoor air topics: particle size, filtration media, how often a room's air gets replaced, and humidity.
The size
How small is a fine particle?
Particulate matter, or PM, is anything solid or liquid floating in the air: dust, pollen, mold spores, smoke, and soot. It's sorted by size, in microns (µm). PM10 is everything 10 µm across or smaller, and PM2.5 is 2.5 µm or smaller. Ultrafine particles are under 0.1 µm. Frying food makes huge numbers of them: over 90% of the particles from one frying episode were ultrafine 31.
Size decides how far a particle gets into your body. Larger particles are mostly caught in your nose and throat. PM2.5 is small enough to reach deep into the lungs 32, and pollution particles under about 0.2 µm have been found in human brain tissue, likely arriving through the nerve that runs from the nose to the brain 33.
A fine particle is a speck beside a hair
At true scale
A human hairAbout 70 µm across
Pollen, mold spores, dust3 to 10 µm, PM10
Fine particles2.5 µm and under, PM2.5
Inside the 10 µm square, magnified
Bacteria and fine dustAbout 1 µm
What HEPA filters are tested on0.3 µm
Ultrafine particles0.1 µm and under
The filter
What matters most for purifiers: how much air they move
Surprisingly, HEPA filters are least efficient at middle-sized particles, around 0.15 to 0.3 µm. They're great at big particles and great at tiny ones (big ones run straight into the fibers, and tiny ones drift around until they stick to one). Even so, to be classified as HEPA, a filter has to catch at least 99.97% of particles at 0.3 µm, and more at every other size. That's remarkable: nearly everything in the air that goes through gets caught in the filter — at most 0.03% of particles of the hardest size for them to handle can get through. So what really matters is how much air is flowing through in the first place.
That's the clean air delivery rate, or CADR, typically in cubic feet per minute. Divide what a purifier cleans in an hour by the room's volume and you get air changes per hour (or ACH): how many times an hour the purifier cleans all the air in the room. We aim for about 5. A 200 square foot bedroom with 8-foot ceilings holds 1,600 cubic feet, so 5 changes an hour takes about 133 CFM.
The catch is noise. A purifier that's too loud gets turned down or off. Manufacturers quote CADR at full speed, which is usually loud, so we rate purifiers by how much air they clean at a quiet setting, about 41 decibels, the level of a library. A bigger unit on low can clean as much air as a small one on high, with far less noise.
Here's what we look for:
A true HEPA filter. The filter standard every reputable purifier uses.
Enough quiet CADR for the room. About 5 air changes an hour at a setting you'll actually leave on.
Filters that last. Most people don't change filters often, and a clogged one cleans far less air, so we favor 12-month filters.
Skip the extras. Ionizers, UV lights, plasma, and photocatalytic modes are mostly marketing, and some can make things worse 34.
All of this is about particles. Gases are a separate job. VOCs pass straight through HEPA; catching them takes a thick bed of activated carbon, and formaldehyde needs carbon treated with something like potassium permanganate. We cover all of this, with picks by room size, in our free purifier guide (no affiliate links) and in how we pick purifiers.
A small purifier barely dents a big room
Modeled time to clear 90% of the smoke after cooking, with 8-foot ceilings
No purifier
Small, 50 CFM
Mid-size, 150 CFM
Large, 300 CFM
Green bars reach our target of 5 air changes an hour in this room.
The exchange
CO2 shows how fresh the air is.
Every breath adds CO2. Outdoors it sits around 400 ppm. Indoors it climbs until the outdoor air coming in balances what people add, so it tracks the number of people, the room's size, and how much outdoor air gets in. That makes it a good gauge of ventilation.
At these levels, it's not clear that CO2 itself is a problem, but everything that builds up alongside it certainly is 35.
Closed bedrooms climb highest. In 20 New Zealand bedrooms, half peaked above 2,000 ppm, and newer, more airtight homes were worse 36.
Note: it's important to consider where the new air is coming from when ventilating. If it's outdoors and the air quality is bad, that can pose its own issues (unless it's being filtered through something on the way in). Or, if the air pressure dynamics are causing your bedroom to take in new air from, say, the garage, that can be an issue too.
Two people in a closed room pass 2,000 ppm by morning
Modeled CO2 overnight in a 130 sq ft bedroom · ppm
Two people, door and window shut. CO2 climbs all night and is still rising at dawn. Rooms that averaged about 2,400 to 2,600 ppm meant worse sleep and next-day concentration than the same rooms with fresher air 37.
One person in the same room: half the CO2, but still well above outdoor levels by morning. In a sleep lab, deep sleep shrank as CO2 rose from 680 to 920 to 1,350 ppm 38.
Two people with the door open to the rest of the house. In Danish bedrooms, opening the door lowered CO2 but didn't improve sleep the way an open window did 39.
Two people with a window open. Outdoor air keeps CO2 low all night. In one study, bedrooms averaged 717 ppm with a window or door open, against 1,150 ppm with both closed 40.
The balance
Humidity can be too low or too high.
Relative humidity is how much water vapor is in the air, as a percentage of the most the air could hold at that temperature. Warm air can hold more water than cold air, so the same air reads a lower percentage when it's warmed and a higher one when it's cooled. That's why heated homes get so dry in winter: cold outdoor air holds little water to begin with, and heating it drops its relative humidity further 41.
Cool air far enough and it hits 100%. That temperature is the dew point, and it's why water beads on a cold window or a cold pipe — the air touching it has maxed out its ability to carry water.
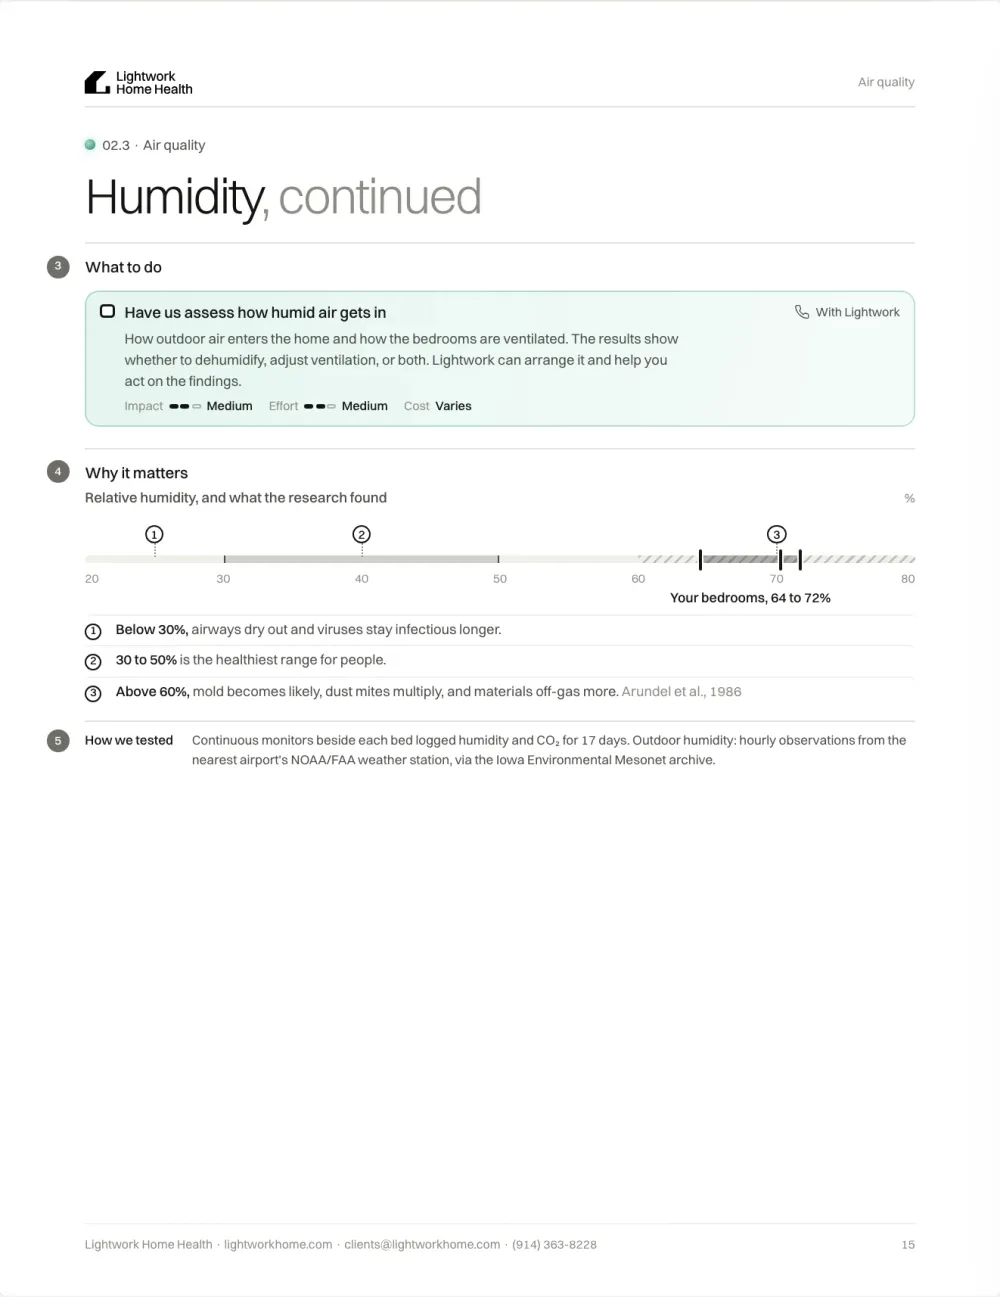
Too dry, and your eyes, skin, and airways dry out, and flu virus survives longer. Too damp, and dust mites multiply, mold can grow, and furniture gives off more formaldehyde 42. The middle, roughly 40 to 60%, keeps most of them down 26.
Too dry and too damp each bring their own problems
Relative humidity, and where each problem starts
Too dryOur rangeToo damp
020406080100%
Flu virus stays infectious23% and below 23
Eyes and skin dry outBelow 30% 43
Dust mites multiplyAbove 50% 2625
Mold can growAbove 60% 26
Dust mites start inside our range, so the lower half, 40 to 50%, is the best spot if they're a concern.
Exposure 1 · Every room
Particles.
The evidence that fine particles harm the heart and lungs is strong. In 2021, particle pollution was the world's leading risk factor for disease, 8.0% of the global burden, ahead of high blood pressure and smoking 44. At home, more than a quarter of it comes in spikes from things like cooking 1.
In trials, purifiers lowered blood pressure by up to 3.9 mm Hg
Change in systolic blood pressure, real purifier versus sham · mm Hg
Average change95% confidence interval, where reported
10 trials, pooledMedian of 13.5 days of filtering 3
−3.9
17 trials, the least biasedLeaving out trials at high risk of bias 45
−3.6
17 trials, all of themAbout 880 people 45
−2.4
Older adults in DetroitThree days, double-blind 46
−3.2
Older adults, cleaner air to startFour weeks, one bedroom unit 47
+0.5
Lower is better.
Settled
Heart disease
4mm Hglower systolic blood pressure with home air cleaners, across 10 trials 3
In 2010, the American Heart Association concluded that the evidence on PM2.5 is consistent with a causal link to heart attacks, strokes, and cardiovascular death 48, and in 2020 it called that evidence unequivocal 49. In 65,893 women, each 10 µg/m³ of PM2.5 was associated with a 24% higher risk of a cardiovascular event and a 76% higher risk of dying of one 50.
Filtering the air at home works fast. In a double-blind trial in older adults, real HEPA filters cut personal PM2.5 exposure from 15.5 to 7.4 µg/m³ and lowered systolic pressure by 3.2 mm Hg in three days 46. In a town with wood smoke, filters improved blood vessel function by 9.4% and cut an inflammation marker by 33% 51. In a randomized exposure study, particles from toasting bread raised blood pressure an hour after the exposure began 52.
Key studies10 studies
3Walzer et al. (2020)HypertensionPaper ↗Over a median 13.5 days, home air cleaners reduced systolic BP by about 4 mm Hg (-3.94; 95% CI -7.00 to -0.89); diastolic change not significant.Systematic review and meta-analysis, 10 trials, n=604.
46Morishita et al. (2018)JAMA Intern MedPaper ↗Personal PM2.5 fell from 15.5 (sham) to 7.4 µg/m3 (true HEPA); any filtration for 3 days lowered systolic BP by 3.2 mm Hg.Randomized double-blind crossover, n=40 older adults, Detroit. Limits: Small and very short trial; measured blood pressure, not clinical events.
48Brook et al. (2010)CirculationPaper ↗Concluded the evidence is "consistent with a causal relationship" between PM2.5 and cardiovascular morbidity and mortality; exposures of hours to weeks can trigger events, and reductions in PM lower cardiovascular mortality within a few years.AHA scientific statement.
49Rajagopalan et al. (2020)CirculationPaper ↗States that "unequivocal evidence of the causal role" of PM2.5 in cardiovascular disease has emerged since 2010, and reviews the most tested personal measures including portable air cleaners.AHA scientific statement on personal interventions (air purifiers, masks, etc.).
50Miller et al. (2007)N Engl J MedPaper ↗Each 10 µg/m3 PM2.5 associated with 24% higher risk of a cardiovascular event (HR 1.24) and 76% higher risk of cardiovascular death (HR 1.76).Women's Health Initiative cohort, n=65,893 postmenopausal women.
45Faridi et al. (2023)Ecotoxicol Environ SafPaper ↗Pooled SBP -2.35 mm Hg and DBP -0.81 mm Hg; excluding high risk-of-bias studies, -3.62 and -1.35 mm Hg; mean purifier efficiency 59.8%.Meta-analysis, 17 true-vs-sham trials, ~880 participants.
51Allen et al. (2011)Am J Respir Crit Care MedPaper ↗Filters cut indoor fine particles 60%, with a 9.4% improvement in endothelial function (reactive hyperemia index) and 32.6% lower C-reactive protein.Randomized crossover, n=45 healthy adults, 7-day periods. Limits: Surrogate biomarkers, small sample and short duration.
52Soppa et al. (2017)Environ ResPaper ↗Particles from toasting bread raised systolic BP, up to 2.2 mm Hg per 10 µg/m3 PM2.5 one hour after exposure began; candle and frying particles had no consistent BP effect.Randomized sham-controlled crossover, n=54 (candles, toasting bread, frying sausages).
47Brook et al. (2026)J Clin HypertensPaper ↗A single bedroom HEPA unit cut bedroom PM2.5 from 8.3 to 1.3 µg/m3 and 24-h personal exposure from 12.4 to 5.1 µg/m3, but home systolic BP did not differ overall (127.0 vs 126.5 mm Hg).Randomized double-blind crossover, n=33 older adults, 4 weeks per arm. Limits: Small trial; suggested subgroup modification is exploratory.
53Brugge et al. (2025)Journal of the American College of CardiologyPaper ↗Home HEPA filtration lowered systolic BP in participants starting with elevated systolic BP; no significant benefit for normal systolic BP or diastolic BP.Pragmatic randomized crossover trial; 154 adults living near highways. Limits: Predominantly White, higher-income participants; one-month periods and subgroup-dependent benefit.
Counterpoints. The trials ran for days to weeks and measured blood pressure, not heart attacks. Where indoor air was already clean, a bedroom purifier didn't change blood pressure overall 47, and in a 2025 trial the benefit showed up only in people whose pressure started high 53.
Consistent
Asthma and lung disease
54%fewer teens had low lung function as Southern California's air got cleaner, 7.9% down to 3.6% 4
Across 47 studies of children, PM2.5 was associated with more asthma and wheeze 54. In adults, each 10 µg/m³ was associated with an 18% higher risk of developing COPD 55. As PM2.5 and NO2 fell in Southern California, children's lungs grew better 4.
Purifier trials in children with asthma found fewer unscheduled asthma visits 56 and more symptom-free days 57. In former smokers with COPD, six months of air cleaners meant fewer symptoms, flare-ups, and rescue inhaler puffs 58.
Key studies7 studies
4Gauderman et al. (2015)N Engl J MedPaper ↗As PM2.5 and NO2 fell in Southern California, lung-function growth improved; children with clinically low FEV1 at age 15 fell from 7.9% to 6.3% to 3.6%.Children's Health Study, three cohorts, n=2,120 children. Limits: Ambient multi-pollutant changes were not randomized and cannot be assigned solely to PM.
56Lanphear et al. (2011)PediatricsPaper ↗Active HEPA cleaners led to 42 fewer unscheduled asthma visits (P = .043) and 25% vs 5% reduction in particles; symptoms not significantly different.Double-blind RCT, n=225 children with asthma.
54Keleb et al. (2025)BMC Public HealthPaper ↗PM2.5 associated with OR 1.05 for asthma and OR 1.15 for wheeze; PM2.5 stronger than PM10.Meta-analysis, 47 studies, n=417,874 children.
55Park et al. (2021)Environ ResPaper ↗Each 10 µg/m3 PM2.5 associated with pooled HR 1.18 (95% CI 1.13 to 1.23) for new COPD.Meta-analysis of 7 prospective studies.
57Butz et al. (2011)Arch Pediatr Adolesc MedPaper ↗Air cleaners lowered indoor PM2.5 (about -16 to -20 µg/m3 vs +3.5 in controls) and significantly increased symptom-free days.RCT, n=126 children.
58Hansel et al. (2022)American Journal of Respiratory and Critical Care MedicinePaper ↗Primary total respiratory quality-of-life score was not significantly improved, but symptoms, moderate exacerbations and rescue-medication use improved.Six-month blinded randomized trial; 116 former smokers with moderate-to-severe COPD randomized. Limits: Primary endpoint null; stronger per-protocol benefits may reflect adherence differences; excluded low-pollution homes.
59Aguilera et al. (2021)PediatricsPaper ↗Per 10 units, wildfire PM2.5 raised pediatric respiratory visits 30.0% vs 3.7% for non-smoke PM2.5, about 10 times more harmful, especially ages 0 to 5.Time-series of pediatric ER/urgent care visits, San Diego, 2011 to 2017.
Counterpoints. The cohorts measured outdoor air, and California's cleanup cut several pollutants at once. In the purifier trials, the main measures, like symptom scores, often didn't change; the benefits showed up in secondary ones 5658.
Emerging
Dementia and thinking
8%higher dementia risk per 5 µg/m³ of long-term PM2.5, across more than 24 million people 5
The Lancet Commission on dementia lists air pollution as one of 14 risk factors you can change 60. In 56.5 million Medicare enrollees, PM2.5 was linked to Lewy body dementia, and mouse experiments showed a plausible way it happens 61. Pollution particles have been found in human brain tissue 33.
Shorter-term effects show up too. In controlled experiments, smoke from burning candles reduced attention four hours later 62, and higher indoor PM2.5 lowered attention and memory scores in a randomized crossover trial of 90 adults 63.
Key studies7 studies
5Best Rogowski et al. (2025)Lancet Planet HealthPaper ↗Pooled HR 1.08 (95% CI 1.02 to 1.14) per 5 µg/m3 PM2.5 for dementia; black carbon HR 1.13 per 1 µg/m3; overall certainty moderate.Meta-analysis, 32 studies; PM2.5 analysis 21 studies, n=24,030,527.
61Zhang et al. (2025)SciencePaper ↗PM2.5 exposure raised Lewy body dementia risk; in mice PM2.5 caused brain atrophy that did not occur in α-synuclein-deficient mice, and PM2.5 generated a highly toxic α-synuclein strain resembling those in LBD patients.Medicare cohort of 56.5 million plus mouse experiments.
60Livingston et al. (2024)LancetPaper ↗Air pollution is one of 14 modifiable dementia risk factors; the Commission recommends reducing exposure to air pollution.Lancet Commission review.
33Maher et al. (2016)PNASPaper ↗Abundant combustion-derived magnetite nanoparticles found in human brains; particles under about 200 nm can enter the brain directly via the olfactory bulb.Mechanistic, magnetic analysis and electron microscopy of human brain tissue.
62Faherty et al. (2025)Nature CommunicationsPaper ↗Candle-generated pollution reduced selective attention and facial-emotion discrimination four hours after exposure; other tested domains were not consistently affected.Controlled within-person crossover experiment; 26 adults. Limits: Small experimental sample; candle smoke is a mixture.
63Zhou et al. (2026)iSciencePaper ↗Higher indoor PM2.5 reduced attention and memory performance and heart-rate variability; coordination and reasoning were not impaired.Randomized single-blind crossover experiment; 90 working-age adults. Limits: Short laboratory candle-smoke exposure; biological mediation analysis is exploratory.
64Wilker et al. (2023)BMJPaper ↗HR 1.04 (95% CI 0.99 to 1.09) per 2 µg/m3 PM2.5 overall; HR 1.42 (1.00 to 2.02) in the seven studies that actively assessed every participant for dementia.Meta-analysis, 51 studies (14 for PM2.5). Limits: Most studies had substantial bias concerns; overall confidence interval included no association.
Counterpoints. The dementia studies are observational and use outdoor air. In one meta-analysis, the overall estimate wasn't statistically significant, though it was stronger in studies that checked everyone for dementia 64. No trial has tested whether cleaner home air prevents dementia.
Unsettled
Preterm birth and birth weight
12%higher risk of preterm birth per 10 µg/m³ of PM2.5, pooled across 40 studies 6
PM2.5 during pregnancy has been linked to preterm birth and low birth weight across many countries 6, and in a review of US births, PM2.5 or ozone was linked to preterm birth in 19 of 24 studies 65.
Trials of cleaner air during pregnancy haven't confirmed it. In Mongolia, HEPA purifiers cut indoor PM2.5 by 29% but didn't change birth weight overall 7; children's IQ at four was 2.5 points higher, but the result could have been chance 66. In a trial of 3,200 pregnant women, switching from biomass to bottled gas stoves didn't change birth weight either, though exposure stayed high 67.
Points to a risk
Studies2 studies
6Ghosh et al. (2021)PLoS MedPaper ↗Per 10 µg/m3 ambient PM2.5: 22 g lower birth weight, 11% higher LBW risk, 12% higher preterm birth risk; an estimated 15.6% of LBW and 35.7% of preterm births globally attributable to total PM2.5.Meta-regression (44 birth weight, 40 LBW, 40 PTB studies) plus global burden estimate.
65Bekkar et al. (2020)JAMA Netw OpenPaper ↗PM2.5 or ozone associated with preterm birth in 19 of 24 studies and low birth weight in 25 of 29 studies; highest risk for mothers with asthma and Black mothers.Systematic review, 68 studies, 32.8 million US births. Limits: Combines pollutants and heat; heterogeneous observational studies.
Points the other way
Studies3 studies
7Barn et al. (2018)Environ IntPaper ↗Air cleaners cut indoor PM2.5 29%; no overall birth weight difference (+18 g, not significant), but +85 g (95% CI 3 to 167 g) among 429 term births (prespecified subgroup).RCT, n=540 pregnant women, Ulaanbaatar, Mongolia. Limits: High-pollution setting; subgroup-specific result; same UGAAR trial underlies the child-development publications.
66Ulziikhuu et al. (2022)Environ Health PerspectPaper ↗Children of the air-cleaner group had full-scale IQ 2.5 points higher (95% CI -0.4 to 5.4), 2.8 after adjustment for preterm imbalance; confidence intervals just crossed zero.RCT follow-up, 475 children at age 4. Limits: Imprecise result; same UGAAR trial as fetal-growth and autistic-trait papers.
67Clasen et al. (HAPIN trial) (2022)N Engl J MedPaper ↗RCT of 3,200 pregnant women in four countries: switching from biomass to LPG stoves cut personal PM2.5 from 70.7 to 23.9 µg/m3, but birth weight did not differ (adjusted difference 19.6 g, 95% CI -10.1 to 49.2). Residual exposure stayed well above WHO levels.Randomized trial, 3,200 pregnant women in four countries.
Counterpoints. The trials ran where air pollution is far worse than in most homes in the US or Europe, so they don't tell us much either way about a typical home.
What we suggest
Fewer particles. Put a HEPA purifier wherever you spend the most time, bedrooms first, and size it by the air it cleans on a quiet setting, not on high. Our purifier guide does the math for your room. Run it all the time, at the highest setting you can comfortably live with, and change filters on schedule.
Cook with the range hood on, and leave it running after you finish: in a test house, exposure after cooking was higher than during it 68. A purifier in the kitchen while you cook helps far more than one elsewhere, cutting ultrafine particles a further 53%, against 2 to 13% for one in the bedroom or living room 69. During wildfire smoke, close up and run the purifiers: indoor PM2.5 nearly tripled in California buildings on fire days, less so with air conditioning or filtration 70. And ideally, don't use candles or incense 6271.
Exposure 2 · Anything that burns
Combustion gases.
Anything that burns fuel indoors adds gases to your air. A gas stove emits nitrogen dioxide (NO2) whenever it's lit, and typically leaks a little gas even when it's off. A faulty furnace, water heater, or generator can add carbon monoxide, which you can't see or smell. Wood stoves and fireplaces burn too; the studies in this chapter are about gas.
Burning gas indoors meant about 3 times the NO2
Nitrogen dioxide measured indoors, with and without gas · ppb
Electric, or after the switchGas, or before the switchBelow the WHO annual guideline
Homes of children with asthmaElectric versus gas ranges, New England 72
3.0×
Rural California homesElectric versus gas, 48-hour medians 73
2.7×
Cleveland homes, before and afterGas stoves swapped for electric 74
3.3×
Classrooms, before and afterUnflued gas heaters replaced 9
3.0×
The WHO annual guideline is 10 µg/m³, about 5.3 ppb 75. Cooking peaks run far higher: 41% of gas homes in the California study averaged more than 100 ppb over an hour, and no electric homes did 73.
Settled
Carbon monoxide poisoning
438deaths a year in the US from accidental carbon monoxide poisoning, 54% of them at home 8
Carbon monoxide (CO) is odorless and reduces how much oxygen your blood carries. Accidental CO deaths in the US rose from 2015 to 2021, the first rise in four decades 76, and hospitalization rates didn't decline from 2003 to 2013 77.
Surviving isn't always the end of it. 15 to 40% of poisoned patients develop lasting problems with memory and thinking 78, and in a trial, a quarter did even with hyperbaric oxygen treatment 79. Large cohorts in Taiwan link poisoning to more dementia and heart failure years later 8081.
Even low levels can matter. In a double-blind trial in men with heart disease, CO that raised blood levels to just 2 to 4% brought on heart strain sooner during exercise 82. In one emergency room, 7 of 37 people with winter headaches had CO poisoning 83.
Key studies10 studies
8Sircar et al. (2015)Am J Emerg MedPaper ↗There were 6,136 unintentional non-fire CO deaths (an average of 438 a year), and 54% occurred at home. Rates were highest at age 85 and older (6.00 per million). CO was the second most common non-medicinal poisoning death.CDC national death-record surveillance.
82Allred et al. (1989)N Engl J MedPaper ↗At carboxyhemoglobin of only 2.0% and 3.9%, time to ischemic ST changes on exercise fell by 5.1% and 12.1%, and time to angina fell by 4.2% and 7.1%, in a dose-dependent way.Randomized, double-blind exposure study, n=63 men with coronary artery disease. Limits: Chamber concentrations were 117/253 ppm for roughly an hour.
76Hampson (2023)Clin ToxicolPaper ↗Accidental CO deaths rose from 2015 to 2021 for the first time in four decades, and in 2021 accidental deaths (543) outnumbered intentional deaths (524). More than half of accidental deaths happened at home.CDC WONDER mortality analysis.
77Stearns & Sircar (2019)Am J Emerg MedPaper ↗About 14,365 people were hospitalized (2003 to 2013) and about 101,847 visited the ED (2007 to 2013) for unintentional non-fire CO poisoning. Hospitalization rates did not decline.CDC analysis of national inpatient and ED databases.
78Rose et al. (2017)Am J Respir Crit Care MedPaper ↗CO poisoning affects about 50,000 people a year in the US. Long-term neurocognitive deficits occur in 15 to 40% of patients, and about one-third of moderate to severe cases show cardiac dysfunction. Neurological deficits do not necessarily correlate with blood CO levels.Narrative clinical review.
79Weaver et al. (2002)N Engl J MedPaper ↗Cognitive sequelae at 6 weeks occurred in 25.0% of the hyperbaric oxygen group and 46.1% of the normobaric group (adjusted OR 0.45), with benefit persisting at 12 months.Double-blind RCT, n=152.
80Zhang et al. (2024)Psychiatry InvestigPaper ↗CO poisoning was associated with higher dementia incidence (adjusted HR 2.61, 1.56 to 4.36), with the highest risk in younger age groups.Meta-analysis of 3 cohorts (n=134,563, follow-up 9 to 12 years). Limits: All studies were Taiwanese and observational; possible overlapping administrative populations and residual confounding.
81Huang et al. (2021)Circ Heart FailPaper ↗Adjusted HR for heart failure was 2.01 (1.74 to 2.32) and stayed at 1.85 beyond 2 years. CO-exposed rats showed reduced cardiac function.Taiwan national cohort (20,942 CO patients vs 62,826 controls) plus a rat model.
83Heckerling (1987)Am J Emerg MedPaper ↗7 of 37 (18.9%) had carboxyhemoglobin above 10%, and no ED physician had suspected CO in any of them. Gas space heaters or stoves used for heat, and housemates with headaches, were clues.ED case series, n=37 patients with headache during heating season.
84Choi (1983)Arch NeurolPaper ↗Delayed neurologic sequelae developed in 2.75% overall and 11.8% of admitted patients, after a lucid interval of 2 to 40 days (mean 22.4). Symptoms included mental deterioration, incontinence, gait disturbance and mutism, and 75% recovered within a year.Case series of 2,360 CO victims in Korea (many exposed through home heating).
Counterpoints. The long-term figures come from people hospitalized with poisoning, not from homes with trace CO, and the dementia studies all use Taiwanese insurance records. The low-level trial used about an hour in a chamber.
Consistent
Asthma symptoms
68%lower risk of breathing trouble at night for children with asthma after classroom gas heaters were replaced, in a trial 9
In 1,342 children with asthma, more NO2 at home meant more severe asthma, more wheeze, more night symptoms, and more rescue medication, at levels well below the outdoor standard 85. The trials agree. In a double-blind study, unflued gas heaters in classrooms brought more cough and wheeze 86, and in homes, cleaner heating meant less night cough and fewer missed school days 87.
Swapping a gas stove for an electric one cut kitchen NO2 by 51% 88.
Key studies7 studies
9Pilotto et al. (2004)Int J EpidemiolPaper ↗Replacing unflued gas heaters cut classroom NO2 from 47.0 to 15.5 ppb. Difficulty breathing at night (RR 0.32), chest tightness during the day (0.45) and daytime asthma attacks (0.39) fell. Lung function did not differ.Cluster RCT in 18 Australian schools (45 intervention and 73 control children with asthma). Limits: School classrooms with high NO2 from unflued heaters.
85Belanger et al. (2013)EpidemiologyPaper ↗Every 5-fold increase in NO2 above 6 ppb was associated with higher asthma severity (OR 1.37), wheeze (1.49), night symptoms (1.52) and rescue medication use (1.78).Prospective year-long cohort, n=1,342 children aged 5 to 10 with asthma (Connecticut, Massachusetts), with repeated home NO2 measurements. Limits: Observational; the threshold is modeled.
86Marks et al. (2010)Environmental health perspectivesPaper ↗Unflued heaters increased NO2/formaldehyde and cough/wheeze, especially in atopic children, without detectable lung-function decline.Double-blind cluster randomized crossover trial; 400 primary-school students in 22 schools. Limits: Mixed emissions prevent attributing everything specifically to NO2; school heating context.
87Howden-Chapman et al. (2008)BMJPaper ↗Cleaner, more effective heating reduced wheeze-related sleep disturbance, night cough, school absence, and healthcare use; lung-function improvement was not significant.Randomized controlled trial; 409 children ages 6–12 with asthma in New Zealand. Limits: Intervention changed temperature as well as pollution, so effects cannot be assigned solely to gas/NO2 reduction.
89Hansel et al. (2008)Environ Health PerspectPaper ↗Mean in-home NO2 was 30.0 ppb (range 2.9 to 394). Each 20 ppb increase was associated with more days of limited speech (IRR 1.15), cough (1.10) and nocturnal symptoms (1.09). Gas stoves and using the oven or stove for heat predicted higher NO2.Longitudinal cohort, n=150 preschool children with asthma in Baltimore, with bedroom NO2 monitoring. Limits: Vulnerable urban cohort and correlated pollutants; not randomized.
90Jarvis et al. (1996)LancetPaper ↗Women who mainly cooked with gas had more wheeze (OR 2.07), waking with shortness of breath (2.32) and asthma attacks (2.60), plus reduced FEV1. These associations were not seen in men.Population sample of adults aged 20 to 44 in East Anglia, UK (659 women, 500 men interviewed).
91Pan et al. (2024)Int J Hyg Environ HealthPaper ↗Gas cooking increased the risk of shortness of breath at rest (OR 1.38, 1.06 to 1.79) and wheeze with breathlessness (1.32, 1.00 to 1.74). Effects were larger with both a gas hob and gas oven, bottled gas, or cooking more than 60 minutes a day, and were stronger in women.Repeated surveys about 11 years apart, n=4,337 adults in 19 centres across 9 countries.
Counterpoints. The trials removed unflued heaters, which put out far more NO2 than a typical vented stove. The home studies are observational.
Unsettled
New asthma in children
32%higher odds of childhood asthma with gas cooking, across 41 studies 10
Whether gas cooking causes asthma in the first place is debated. An older meta-analysis found 32% higher odds of childhood asthma with gas cooking 10. A large WHO-funded review found a smaller increase that wasn't statistically significant 11, and a German birth cohort of 5,078 children found none 92.
A third review argues that most of these studies are low quality. It was written by consultants with ties to the gas industry 93.
Points to a risk
Studies1 study
10Lin et al. (2013)Int J EpidemiolPaper ↗Gas cooking was associated with childhood asthma (OR 1.32, 95% CI 1.18 to 1.48). Indoor NO2 was associated with current wheeze (OR 1.15, 1.06 to 1.25). The estimate for asthma per 15 ppb NO2 was not significant (OR 1.09, 0.91 to 1.31).Meta-analysis of 41 studies. Limits: Heterogeneous observational studies.
Points the other way
Studies3 studies
11Puzzolo et al. (2024)Lancet Respir MedPaper ↗Compared with electricity, gas significantly increased the risk of pneumonia (OR 1.26, 1.03 to 1.53) and COPD (OR 1.15, 1.06 to 1.25). Smaller, non-significant effects were seen in higher-quality studies. The increase in childhood asthma was small and not significant (OR 1.09, 0.99 to 1.19).WHO-funded systematic review and meta-analysis of 116 studies. Limits: A correction appeared online in August 2026 (PMID 42546725).
92Casas et al. (2012)Int J Hyg Environ HealthPaper ↗A German birth cohort of 5,078 children followed to age 10 found no significant association between gas cooking and asthma or wheeze. Gas cooking was correlated with dampness, smoking and pets, which shows how confounded this exposure is.Birth cohort (GINIplus/LISAplus), 5,078 children followed to age 10.
93Li et al. (2023)Glob EpidemiolPaper ↗This systematic review of 66 studies argues the literature is mostly cross-sectional and low quality, and that the few cohort studies are largely null. The authors are from Gradient, which discloses past work for gas-interested organizations, and a 2024 follow-up commentary on PAFs was funded by the American Gas Association.Systematic review of 66 studies by consultants with disclosed gas-industry ties.
Counterpoints. These studies are observational, and homes that cook with gas differ in other ways, like dampness, smoking, and pets 92. A correction to the WHO-funded review was published in 2026.
Emerging
Benzene from gas stoves
99%of unburned gas samples from home stoves contained benzene 12
Stoves leak. More than three-quarters of the unburned gas a stove releases escapes while it's off 94, and that gas carries benzene, a known cause of leukemia 14. A leaking stove can push indoor benzene to levels comparable to secondhand smoke 12. Burning makes more: gas burners gave off 10 to 25 times more benzene than electric stoves, and it spread to bedrooms; induction gave off none that could be detected 95.
You can't count on your nose. Based on odorant levels, small leaks may never be smelled 96, and gas in Europe carried more benzene and less odorant than in North America 97.
Key studies7 studies
12Lebel et al. (2022)Environ Sci TechnolPaper ↗Benzene was detected in 99% of samples (regional means 0.7 to 12 ppmv, maximum 66 ppmv). Gas leaking from stoves and ovens while off can push indoor benzene above California's 8-hour Reference Exposure Level of 0.94 ppbv, comparable to secondhand smoke.185 unburned gas samples from 159 home stoves in 7 California regions.
95Kashtan et al. (2023)Environ Sci TechnolPaper ↗Gas and propane burners on high, and ovens at 350 °F, emitted 2.8 to 6.5 µg of benzene per minute, 10 to 25 times more than electric coil or radiant stoves. Induction stoves and the food itself emitted no detectable benzene. Benzene spread to bedrooms, in some homes staying above chronic health benchmarks for hours after the stove was turned off.Emissions measurements in 87 homes (California, Colorado). Limits: Exposure-only study; benchmark exceedance is not an observed cancer outcome.
94Lebel et al. (2022)Environ Sci TechnolPaper ↗Stoves emit 0.8 to 1.3% of the gas they use as unburned methane, and more than three-quarters of that happens while the stove is off. Without a range hood or with poor ventilation, a home can exceed the 1-hour NO2 standard (100 ppb) within a few minutes of cooking, especially in small kitchens.Methane measured in 53 homes and NOx in 32 homes.
96Michanowicz et al. (2022)Environ Sci TechnolPaper ↗The samples contained 296 non-methane VOCs, 21 of them hazardous air pollutants. Benzene was found in 95% of samples (mean 164 ppbv), and winter benzene was nearly 8 times higher than summer. Based on odorant levels, about 21 ppmv of methane could persist in air without being smelled.234 gas samples from 69 homes in Greater Boston.
97Sparks et al. (2026)Environ Res LettPaper ↗Benzene in European gas was 9 to 73 times higher than in North America, and odorant levels were lower. In 3 of 35 homes, stove-off leaks produced modeled benzene above the EU annual limit of 1.6 ppbv.Stove-off leak measurements in 35 homes and 78 gas samples from 7 cities (UK, Netherlands, Italy). Limits: Small geographically specific sample; modeled exposure, no measured health effects; European gas only.
98Garg et al. (2025)J Hazard MaterPaper ↗Medium to high stove use without enough ventilation significantly raised incremental lifetime cancer risk, and children's risk was 1.85 times that of adults. Non-cancer hazard quotients stayed below 1. Vented hoods with at least 75% capture efficiency notably reduced kitchen benzene.Multizone indoor air model (NIST CONTAM) across 24 floorplans, focused on the 6.3 million US residents with the top 5% highest-emitting stoves.
99Tam et al. (2026)Curr Environ Health RepPaper ↗At least 41 toxic air contaminants are released through gas leakage and combustion. Only formaldehyde and benzene have enough data to quantify, and their emission factors vary up to 100-fold. Heaters, water heaters and dryers are rarely studied.Systematic review of 25 studies.
Counterpoints. These are measurements and models of exposure. No study has yet linked gas stoves to cancer, so this card rates the exposure, not a cancer risk.
What we suggest
No fumes. Put a CO alarm near every bedroom: in one review of CO deaths, about half of the people who died at home were probably asleep 100. Standard alarms are designed not to sound at low levels, so consider a low-level one 101. Never run a generator indoors, in a garage, or near a window 102.
Get gas leaks fixed, even small ones you can't smell 96. If you cook with gas, use the back burners and run a hood that vents outdoors 103104; a purifier with carbon in the kitchen helps too 88. If you're replacing a stove, consider an induction cooktop, which cut NO2 by 56% in a pilot trial 105.
Exposure 3 · Furnishings and products
VOCs.
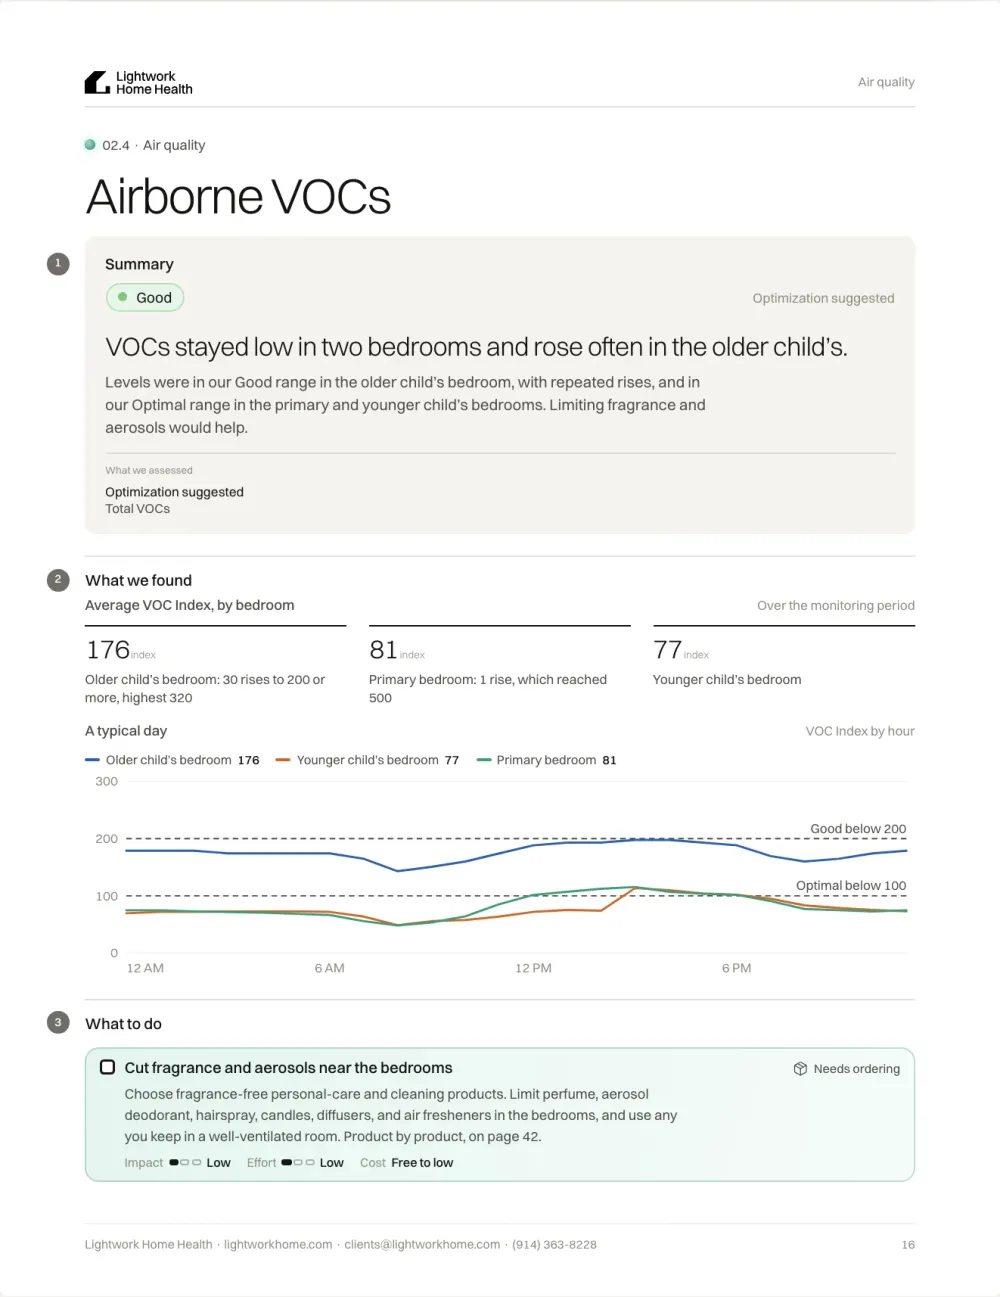
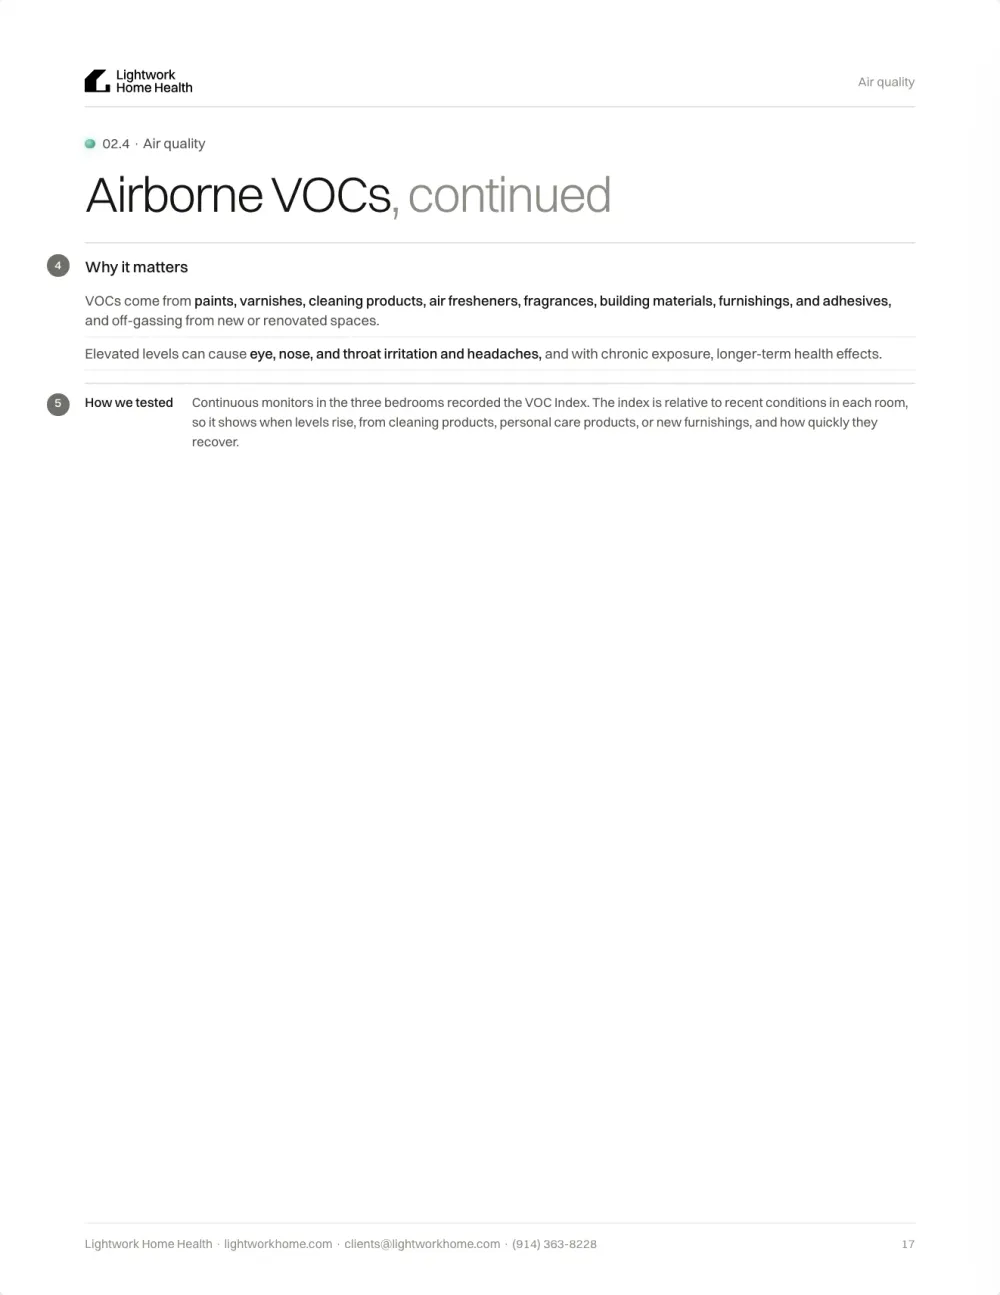
VOCs, volatile organic compounds, are gases given off by things in your home: new furniture and flooring, paint, cleaning sprays, air fresheners, and fragrance. Formaldehyde, a common VOC, off-gasses faster when it's warm and humid 42, and scents react with indoor ozone to make formaldehyde and ultrafine particles 106107. The strongest evidence of health impacts from airborne VOCs is for formaldehyde and benzene.
Consistent
Cancer
1IARC's group for both formaldehyde and benzene: carcinogenic to humans 1314
EPA's 2024 review concluded that breathing formaldehyde causes nasopharyngeal and sinonasal cancer and myeloid leukemia. Its reference level for long-term exposure is 7 µg/m³ 108; in one study of children's bedrooms, the median was 15.8 µg/m³ 109. WHO says benzene has no safe level of exposure 110.
The human evidence comes mostly from workers. Formaldehyde workers had more nasopharyngeal cancer 111, embalmers had more myeloid leukemia the longer they worked 112, and benzene lowered blood cell counts even below 1 ppm 113. The leukemia link for formaldehyde is disputed: a British cohort found no clear excess 114, and an industry-linked review found none 115.
Points to a risk
Studies6 studies
108US EPA IRIS (2024)IRIS assessmentPaper ↗Formaldehyde inhalation causes nasopharyngeal cancer, sinonasal cancer and myeloid leukemia. It likely worsens asthma symptoms and allergic responses and causes reproductive toxicity. The reference concentration is 7 µg/m3.Agency systematic review.
111Beane Freeman et al. (2013)Am J Ind MedPaper ↗The excess of nasopharyngeal cancer persisted. Highest peak exposure RR was 7.66 (0.94 to 62.34, p-trend 0.005), and highest average intensity RR was 11.54 (1.38 to 96.81).Cohort of 25,619 workers followed through 2004. Limits: Only 10 nasopharyngeal cancer deaths and wide intervals; occupational exposure levels.
112Hauptmann et al. (2009)J Natl Cancer InstPaper ↗Myeloid leukemia rose with years of embalming (more than 34 years: OR 3.9, 1.2 to 12.5) and with cumulative exposure above 9,253 ppm-hours (OR 3.1, 1.0 to 9.6).Case-control study within the funeral industry (168 lymphohematopoietic cases, 48 brain tumor cases, 265 controls).
113Lan et al. (2004)SciencePaper ↗White cells and platelets were significantly lower even at exposures below 1 ppm. Progenitor cells were more sensitive than mature blood cells.Cross-sectional study of 250 exposed workers and 140 controls. Limits: Cross-sectional; occupational exposure levels, above typical residential ones.
110WHO (2010)WHO Regional Office for EuropePaper ↗"Benzene is a genotoxic carcinogen in humans and no safe level of exposure can be recommended." The excess lifetime leukaemia risk is 6 x 10^-6 per µg/m3. For formaldehyde, a 30-minute guideline of 0.1 mg/m3 prevents sensory irritation and, per WHO, long-term effects including cancer.Agency guideline.
116Carlos-Wallace et al. (2016)Am J EpidemiolPaper ↗Occupational and household use of benzene or solvents: summary RR for childhood leukemia 1.96 (1.53 to 2.52), and 2.34 for AML. Risk was higher for maternal and gestational exposure.Meta-analysis (20 studies of occupational or household product exposure; 12 traffic studies). Limits: Several exposure measures are proxies or solvent mixtures; recall bias and confounding remain possible.
Points the other way
Studies3 studies
114Coggon et al. (2014)American journal of epidemiologyPaper ↗Found no clear increased risk of nasopharyngeal, other upper-airway cancers, or myeloid leukemia in the highest exposure category.Occupational cohort with nested case-control analyses; 14,008 British chemical workers followed through 2012. Limits: Rare cancers, exposure classification uncertainty, and occupational setting.
115Vincent et al. (2024)Toxicol SciPaper ↗A systematic review found no significant formaldehyde-lymphohematopoietic cancer association (meta-SMRs 0.50 to 1.51) and no plausible mechanism, citing lack of systemic distribution. This review comes from the industry-consulting literature stream that disputes the EPA and IARC leukemia conclusions.Systematic review and meta-analysis of formaldehyde and blood cancers.
117Beane Freeman et al. (2009)J Natl Cancer InstPaper ↗Peak exposure of 4 ppm or more vs under 2 ppm: all lymphohematopoietic cancers RR 1.37 (1.03 to 1.81) and Hodgkin lymphoma RR 3.96. Myeloid leukemia RR 1.78 (0.87 to 3.64) was not significant, and there was little association with average or cumulative exposure.Same NCI cohort, median follow-up 42 years.
Counterpoints. Workplace doses are far higher than home levels. Cancer risk at home levels is estimated from models, not observed 118.
Emerging
Asthma
49%higher risk of new asthma symptoms with weekly cleaning-spray use, in 3,503 adults 15
Using cleaning sprays every week was associated with new asthma, and the risk rose with use 15. Over 20 years, women who did the cleaning at home lost lung function faster 119. Each 10 µg/m³ of formaldehyde was associated with 20% higher odds of childhood asthma 120, and new flooring laid during pregnancy was associated with five times the odds of wheeze in the baby's first year 121. In a randomized trial, ventilators that lowered VOCs in the homes of children with asthma meant fewer children wheezing 122.
But the evidence is mixed. A review of 53 studies called it poor-quality and inconsistent 16; total VOC levels weren't linked to wheeze in one careful study 123; and air fresheners weren't linked to asthma in 60,529 Japanese children 124. One expert argues that at home levels, formaldehyde rarely gets past the upper airways 125.
Points to a risk
Studies8 studies
15Zock et al. (2007)Am J Respir Crit Care MedPaper ↗Using cleaning sprays at least weekly was associated with new asthma symptoms or medication (RR 1.49, 1.12 to 1.99). Using sprays 4 or more days a week was linked to physician-diagnosed asthma (RR 2.11, 1.15 to 3.89), with a dose-response.ECRHS prospective cohort, 3,503 asthma-free adults across 10 countries. Limits: Self-reported use at follow-up and observational confounding.
119Svanes et al. (2018)Am J Respir Crit Care MedPaper ↗Women responsible for cleaning at home lost FEV1 faster (-22.1 vs -18.5 ml/yr in women who did not clean). Both sprays and other cleaning agents were associated with accelerated decline.ECRHS cohort, 6,235 participants followed over 20 years. Limits: Sex differences, exposure classification and residual confounding.
120Lam et al. (2021)PLoS OnePaper ↗Each 10 µg/m3 increase in formaldehyde was associated with higher odds of a childhood asthma diagnosis (OR 1.20, 95% CI 1.02 to 1.41). The authors rated the evidence "sufficient" for asthma diagnosis and symptoms in children and adults.Navigation Guide systematic review (150 human studies; 10 combined for childhood asthma diagnosis). Limits: Predominantly observational; evidence grading differs from the more cautious 2024 EAACI assessment.
121Franck et al. (2014)Environ IntPaper ↗Laying new floor covering during pregnancy was associated with physician-treated wheeze in the first year (aOR 5.20, 95% CI 1.8 to 15.2). Styrene, ethylbenzene, o-xylene and other VOCs were linked to wheeze.LINA birth cohort, with indoor VOCs measured during pregnancy and at age 1.
122Lajoie et al. (2015)Indoor AirPaper ↗The ventilators lowered formaldehyde, toluene, styrene, limonene and alpha-pinene. Fewer children had any wheezing or 4 or more wheeze episodes, but symptom-days did not change.RCT, 83 children with asthma (43 intervention, 40 control), using heat- or energy-recovery ventilators.
126Rumchev et al. (2004)ThoraxPaper ↗Each 10 µg/m3 increase in toluene roughly doubled asthma risk, and the same increase in benzene roughly tripled it. These associations appeared at levels below the recommendations then accepted.Population-based case-control study (88 cases, 104 controls, ages 6 months to 3 years), with VOCs measured in living rooms. Limits: Small case-control study; asthma classification in toddlers and confounding limit causal inference.
127Wieslander et al. (1997)Int Arch Occup Environ HealthPaper ↗Asthma was more common in people living with newly painted surfaces (OR 1.5, 1.0 to 2.4). Odds were higher for newly painted wood details (OR 2.3) and kitchen painting (OR 2.2), and blood eosinophils were raised.ECRHS cross-sectional sample (n=562), with VOCs measured in 62 homes.
128Mendell (2007)Indoor AirPaper ↗The risk factors identified most often were formaldehyde or particleboard, phthalates or plastics, and recent painting. Renovation, cleaning, new furniture and carpets also showed elevated risks.Review of 21 epidemiologic studies.
Points the other way
Studies4 studies
16Nurmatov et al. (2015)Eur Respir RevPaper ↗A systematic review of 53 studies found the VOC-asthma/allergy evidence "of poor quality and inconsistent". Roughly equal numbers of studies showed harm and no effect.Systematic review, 53 studies.
123Venn et al. (2003)ThoraxPaper ↗TVOC was unrelated to wheezing risk or severity; formaldehyde was associated with more nocturnal symptoms among children already wheezing.Home-measurement case-control study; 193 wheezing children and 223 controls, ages 9–11, Nottingham. Limits: Single study with observational exposure assessment; symptoms do not identify a specific causal chemical.
124Saijo et al. (2022)Indoor AirPaper ↗In the JECS cohort (60,529 children), air freshener/deodorizer use at 1.5 years was not significantly associated with wheeze or asthma at 3 years.Birth cohort (JECS), 60,529 children.
125Wolkoff (2025)Arch ToxicolPaper ↗Over 90% of formaldehyde is retained in the upper airways. Controlled human studies show no lung-function effects up to 4 ppm, and typical indoor levels are far below irritation thresholds. The author argues the meta-analyses may reflect confounding by co-pollutants.Narrative critical review. Limits: Narrative critical review, not a new experiment or systematic effect estimate.
Counterpoints. Nearly all of this is observational, and homes with new furniture, fresh paint, or lots of cleaning differ in other ways too.
Emerging
Headaches and irritation
34.7%of US adults reported health problems, like migraines or trouble breathing, from fragranced products 17
In a later survey across four countries, 32.2% of adults reported fragrance sensitivity 129. Formaldehyde was associated with eye and throat symptoms and fatigue in schoolchildren, even at a median of 2.0 µg/m³ 130, and with sick building symptoms in new Japanese homes, rising with the dose 131.
In a controlled chamber study, though, formaldehyde didn't cause measurable eye irritation below 0.5 ppm, and complaints at lower levels tracked odor and personality 132.
Key studies5 studies
17Steinemann (2016)Air Qual Atmos HealthPaper ↗34.7% reported health problems such as migraine or breathing difficulty from fragranced products, and 15.1% had lost workdays or a job because of them.Nationally representative US online survey (n=1,136).
130Norbäck et al. (2017)Sci Total EnvironPaper ↗Formaldehyde was associated with eye (p=0.004) and throat symptoms (p=0.006) and fatigue (p=0.001), even at a low median of 2.0 µg/m3. Xylene was linked to fatigue.462 students in 8 schools, with measurements.
129Steinemann (2019)Air Qual Atmos HealthPaper ↗32.2% of adults report fragrance sensitivity, including respiratory problems (16.7%), migraine (12.6%) and asthma attacks (7.0%). For 9.5%, effects are severe enough to be considered disabling.Nationally representative surveys in the US, Australia, UK and Sweden (about 1,100 adults each).
131Takigawa et al. (2010)Int Arch Occup Environ HealthPaper ↗About 14% had sick building syndrome (SBS) symptoms, and formaldehyde was a dose-dependent risk factor after adjustment.1,479 residents of 425 new homes, with aldehydes and VOCs measured.
132Lang et al. (2008)Regul Toxicol PharmacolPaper ↗Eye irritation was the most sensitive endpoint. The no-observed-effect level was 0.5 ppm for constant exposure, or 0.3 ppm with 0.6 ppm peaks. Subjective complaints at lower levels were strongly influenced by personality and odor.Double-blind, randomized repeated-measures chamber study (21 volunteers). Limits: Workplace-relevant concentrations and healthy adults.
Counterpoints. The surveys are self-reported, and a smell alone can make people feel unwell.
Emerging
Childhood leukemia
1.54×the odds of childhood leukemia when the home was painted in the 1 to 3 months before conception, pooled from 8 studies 18
Painting during pregnancy and after birth was associated with smaller increases 18. Across 20 studies, parents' use of benzene or solvents, at work or at home, was associated with 1.96 times the risk of childhood leukemia 116, and construction in the home after birth was associated with more leukemia in California 133.
Babies also sleep in their own pocket of air: crib mattresses put 1.8 to 2.4 times more VOCs into an infant's breathing zone than into the rest of the room, more so when new 134.
Key studies5 studies
18Bailey et al. (2015)Cancer Causes ControlPaper ↗Home painting 1 to 3 months before conception: OR 1.54 (1.28 to 1.85). During pregnancy: OR 1.14 (1.04 to 1.25). After birth: OR 1.22 (1.07 to 1.39). Risk was higher when someone other than the parents did the painting.Pooled individual data from 8 case-control studies (up to 4,382 cases).
116Carlos-Wallace et al. (2016)Am J EpidemiolPaper ↗Occupational and household use of benzene or solvents: summary RR for childhood leukemia 1.96 (1.53 to 2.52), and 2.34 for AML. Risk was higher for maternal and gestational exposure.Meta-analysis (20 studies of occupational or household product exposure; 12 traffic studies). Limits: Several exposure measures are proxies or solvent mixtures; recall bias and confounding remain possible.
133Whitehead et al. (2017)Ann EpidemiolPaper ↗Construction in the home between birth and diagnosis was associated with ALL (OR 1.52, 1.14 to 2.02). Painting was associated with ALL in Hispanic children (OR 1.47).California Childhood Leukemia Study case-control (609 ALL, 89 AML, 893 controls).
134Boor et al. (2014)Environ Sci TechnolPaper ↗TVOC in the infant breathing zone was 1.8 to 2.4 times higher than in bulk room air. Emissions were higher from new mattresses and at body temperature.Chamber study of 20 new and used crib mattresses, including an infant thermal manikin.
135Ren et al. (2022)Int J Environ Health ResPaper ↗Renovation in the year before pregnancy (aOR 1.34) and during pregnancy (aOR 1.25) was associated with diagnosed eczema. Composite flooring was linked to rhinitis (aOR 1.36) and eczema (aOR 1.47).Cross-sectional survey of 9,455 preschool children.
Counterpoints. These are case-control studies that rely on parents remembering what they did years earlier. Odds ratios describe relative risk, not the chance that any one child is affected.
What we suggest
Fewer VOCs. Go fragrance-free: cleaning products, laundry, candles, and air fresheners. (One of our founders tried it for a month and never went back, and we all do the same now.) Choose low-emitting flooring, furniture, and paint, plan renovations well before a pregnancy, and air the house out afterward.
If you have an attached garage, an exhaust fan there cut indoor benzene by 62% in a randomized trial 136; store gasoline and small engines outside the house 137. For VOCs, a purifier needs a thick bed of carbon, not just HEPA (our air purifier guide has recommendations for this). Skip photocatalytic air cleaners: used alone in a trial, one was followed by worse lung function 34.
Exposure 4 · Every room, bedrooms most
Stale air.
When a room doesn't get enough outdoor air, everything people and the room give off builds up. We use CO2 as the marker: it rises with every breath, so it shows how stale the air is getting. Bedrooms matter most, since they're shut for hours with people breathing in them. The sleep studies come from bedrooms; most of the evidence on infections and symptoms comes from offices, schools, and dorms.
Emerging
Sleep
10.3minmore deep sleep with better bedroom ventilation, in adults over 65 measured in a sleep lab 19
In dorm rooms that averaged about 2,400 to 2,600 ppm of CO2, fresher air meant better measured sleep and better concentration the next day 37. Ventilation that let CO2 reach 1,000 or 1,300 ppm lowered sleep efficiency compared with 750 ppm, and at 1,300 ppm deep sleep fell and waking stress hormones rose 138. In real Danish bedrooms, sleeping with the window open meant longer, better-rated sleep 39.
Key studies9 studies
37Strøm-Tejsen et al. (2016)Indoor AirPaper ↗Average CO2 was 2,585 vs 660 ppm in one experiment and 2,395 vs 835 ppm in the other. At the lower CO2 level, objectively measured sleep quality improved, as did next-day sleepiness, concentration and logical-thinking test performance.Two field crossover interventions in dorm rooms (n=14 and n=16), each condition lasting 1 week, sleep measured by actigraphy. Limits: Very small experiments; some next-day benefits emerged only when combining one-sided tests; CO2 changed with ventilation.
19Yan et al. (2022)Indoor AirPaper ↗Better ventilation added 10.3 min of deep sleep and 3.7 min of REM sleep. At 30 C vs 27 C, total sleep fell by 26.3 min. The benefits of cooler air and better ventilation were additive.2x2 experimental bedroom study, n=16 adults over 65, full polysomnography (EEG, EOG, EMG, ECG).
138Kang et al. (2024)Building and EnvironmentPaper ↗Ventilation producing 1,000 or 1,300 ppm reduced sleep efficiency versus 750 ppm; at 1,300 ppm deep sleep declined and waking cortisol increased.Balanced field-laboratory intervention; 36 young healthy participants. Limits: Ventilation manipulation cannot isolate CO2; short study, wrist tracker and healthy young sample.
38Wang et al. (2023)BuildingsPaper ↗The share of N3 (deep) sleep fell from 20.4% to 17.3% to 14.4% as CO2 rose. Subjects turned over and woke more, and reported more throat discomfort and nasal congestion.Experimental bedroom, n=10 subjects, 30 PSG nights; average CO2 of 680, 920 and 1,350 ppm, simulating 1, 2 and 3 sleepers.
39Fan et al. (2022)Build EnvironPaper ↗With the window open, people slept longer and rated their sleep better. Opening the door lowered CO2 by a similar amount but did not give the same benefit.Field crossover in 40 real Danish bedrooms over 2 weeks; 29 bedrooms had an effective intervention (95th percentile CO2 changed by more than 200 ppm).
139Fan et al. (2023)Science of the Total EnvironmentPaper ↗Where intervention produced clear ventilation differences, lower ventilation shortened deep sleep; some analyses showed more light sleep and awakenings, but cognition did not improve.Balanced single-blind field intervention; 29 bedrooms over four weeks. Limits: Effects depended on subsets with achieved ventilation contrast; wrist trackers estimate sleep stages.
40Mishra et al. (2018)Indoor AirPaper ↗Average CO2 was 717 ppm with a window or door open vs 1,150 ppm with both closed. Questionnaire depth of sleep (P=.002) and actigraphy sleep phase (P=.003) differed significantly between conditions.Field study, n=17, 5 days, actigraphy plus questionnaires. Limits: Small study; temperature also changed and openings may alter outdoor noise or pollution.
140Basner et al. (2023)Sleep HealthPaper ↗Higher bedroom CO2, particles, temperature and noise were associated with lower sleep efficiency; humidity was not associated with objective sleep efficiency.Repeated-measures observational study; 62 adults monitored over 14 nights. Limits: Observational and actigraphy-based.
141Klausen et al. (2023)Int J Occup Med Environ HealthPaper ↗A double-blind crossover in 36 children aged 10 to 12 slept with 700 ppm, about 2,000 to 3,000 ppm pure CO2, or about 2,000 to 3,000 ppm with bioeffluents. There was no effect on next-day cognition and no meaningful sleep effect.Double-blind crossover, 36 children aged 10 to 12 sleeping in controlled bedrooms. Limits: Children spent 45–70 minutes in well-ventilated rooms before testing; experimental sleep adaptation may affect results.
Counterpoints. These are small studies, 10 to 36 people each, and opening a window changes temperature, noise, and other pollutants along with CO2. In children, adding pure CO2 or stale air to bedrooms made no meaningful difference to sleep 141.
Consistent
Infections and sick days
53%more short-term sick leave among office workers getting half as much outdoor air, in 3,720 employees 20
Reviews agree that lower ventilation is associated with more respiratory infections, asthma symptoms, and sick leave 142, and link ventilation and airflow to the spread of measles, tuberculosis, chickenpox, and flu 143. In college dorms, lab-confirmed respiratory infections were four times as common in the poorly ventilated building (2.83 versus 0.70 a year per person) 144. During a tuberculosis outbreak, fixing ventilation so CO2 stayed under 1,000 ppm was associated with a 97% drop in new cases among contacts 145.
CO2 may also play a small part itself: in lab experiments, CO2 at around 800 ppm kept the COVID virus infectious in the air for longer 146.
Key studies9 studies
142Sundell et al. (2011)Indoor AirPaper ↗Office ventilation up to about 25 L/s per person was linked to fewer SBS symptoms. Lower ventilation was associated with more inflammation, respiratory infections, asthma symptoms and short-term sick leave. Home ventilation above 0.5 air changes per hour was linked to less allergy in Nordic children.Multidisciplinary review of 27 qualifying papers. Limits: Older, predominantly nonresidential evidence and heterogeneous exposure estimates; outdoor air quality also matters.
20Milton et al. (2000)Indoor AirPaper ↗Office workers with lower ventilation (about 12 vs 24 L/s per person) had an RR of 1.53 for short-term sick leave. 35% of short-term sick leave was attributable to the lower ventilation.Cohort, 3,720 employees in 40 buildings.
143Li et al. (2007)Indoor AirPaper ↗Strong and sufficient evidence links ventilation and airflow to the spread of measles, TB, chickenpox, influenza, smallpox and SARS. The data are insufficient to set minimum ventilation rates.Systematic review of 40 studies, 10 judged conclusive.
144Zhu et al. (2020)Environ IntPaper ↗There were 0.70 ARI per person-year in the high-ventilation dorm (6.6 L/s per person) vs 2.83 in the low-ventilation dorm (2.3 L/s per person).Prospective, two dorms, lab-confirmed infections.
145Du et al. (2020)Indoor AirPaper ↗Ventilation fixes cut maximum CO2 from 3,204 ppm to about 600 ppm. Bringing CO2 under 1,000 ppm was independently associated with a 97% decrease (95% CI 50 to 99.9%) in TB incidence among contacts.Natural experiment, 27 TB cases and 1,665 contacts.
147Buonanno et al. (2022)Front Public HealthPaper ↗Students in mechanically ventilated classrooms had at least 74% lower infection risk, and at least 80% lower above 10 L/s per student. Each extra 1 L/s per person cut risk by 12 to 15%.Retrospective cohort, more than 10,000 classrooms, 316 with mechanical ventilation. Limits: Nonrandomized pandemic-era comparison.
148Gettings et al. (2021)MMWRPaper ↗COVID incidence was 39% lower in schools that improved ventilation: 35% lower with dilution alone (windows, doors, fans) and 48% lower with dilution plus HEPA filtration.CDC cross-sectional survey of 169 K-5 schools.
149Myatt et al. (2004)Am J Respir Crit Care MedPaper ↗Airborne rhinovirus was more likely to be detected when weekly CO2 was more than about 100 ppm above outdoor levels. In one case the airborne virus matched an occupant's virus.Field study with outdoor air supply adjusted on purpose.
146Haddrell et al. (2024)Nat CommunPaper ↗A moderate rise in CO2 (e.g. 800 ppm) significantly increased how long SARS-CoV-2 stayed infectious in the air, an effect larger than that of humidity changes. CO2 lowers droplet pH, which slows viral inactivation.Laboratory aerosol levitation experiments plus transmission modeling.
Counterpoints. Most of this comes from offices, schools, and dorms, not homes, and from comparisons rather than trials.
Consistent
Headaches and sore throats
23%more sick building symptoms when office ventilation was halved, in pooled studies 21
Across studies of more than 30,000 people, lower ventilation was associated with worse symptoms in almost all of them, and in about half the CO2 studies, symptoms kept falling below 800 ppm 150. In US offices, each extra 100 ppm of CO2 was associated with more sore throats, sinus symptoms, chest tightness, and wheeze 151. In 165 Chinese homes, higher bedroom CO2 was associated with stuffy odors and skin symptoms 152. And in a chamber, stale air at 3,000 ppm brought on headaches, fatigue, and trouble thinking clearly, while the same level of pure CO2 did not 35.
Key studies7 studies
150Seppänen et al. (1999)Indoor AirPaper ↗Ventilation below 10 L/s per person was linked to worse health or air-quality outcomes in almost all studies. About half of the CO2 studies found SBS risk kept falling below 800 ppm. Relative risks were 1.5 to 2 for respiratory illness and 1.1 to 6 for SBS symptoms.Review of 20 ventilation studies (about 30,000 subjects) and 21 CO2 studies (more than 30,000 subjects).
151Apte et al. (2000)Indoor AirPaper ↗Each 100 ppm of indoor-minus-outdoor CO2 gave ORs of 1.2 to 1.5 for sore throat, nose and sinus symptoms, tight chest and wheezing.Cross-sectional, a probability sample of 41 US office buildings.
21Fisk et al. (2009)Indoor AirPaper ↗Going from 10 to 5 L/s per person raised SBS prevalence by about 23%. Going from 10 to 25 L/s per person lowered it by about 29%.Pooled analysis of published studies.
152Hou et al. (2021)Indoor AirPaper ↗Higher bedroom CO2 was linked to more stuffy odor and skin SBS symptoms. Higher RH was linked to fewer mucosal and skin symptoms (AOR 0.73 to 0.78).1-year prospective bedroom monitoring, 165 homes across 5 climate zones.
35Zhang et al. (2017)Indoor AirPaper ↗Pure CO2 had no significant effect. Bioeffluents at 3,000 ppm CO2 increased headache, fatigue, sleepiness and difficulty thinking clearly, and slowed several cognitive tasks.Chamber crossover, n=25, 255 min exposures. Pure CO2 at 1,000 or 3,000 ppm was compared with ventilation restricted so that occupant bioeffluents reached the same CO2.. Limits: Short exposures and a small sample; cannot rule out effects at other durations or in vulnerable groups.
153Norbäck & Nordström (2008)Int Arch Occup Environ HealthPaper ↗Headache was associated with CO2 (OR 1.19 per 100 ppm). Most mucosal symptoms tracked temperature (ORs about 1.5 per 1 C). The authors note that some CO2 associations may partly be temperature effects.Blinded crossover in classrooms, n=355.
154Wargocki et al. (2002)Indoor AirPaper ↗Ventilation is strongly associated with SBS, inflammation, infections, asthma, allergy and short-term sick leave. Below 25 L/s per person, risk rises. In Nordic homes, ventilation above 0.5 air changes per hour reduces dust mite infestation.Consensus review, 105 papers screened, 30 judged conclusive.
Counterpoints. Most of these are offices. CO2 often moves with temperature, and some symptoms may be the heat instead 153.
Emerging
Thinking and focus
37experiments reviewed: lower ventilation slowed people down across tasks, though pure CO2 on its own mostly didn't 22
The evidence here is for stale air as a whole. In a review of 37 experiments, lower ventilation, with CO2 and everything else building up together, slowed people down across a range of tasks, though their accuracy held 22. In one chamber study, stale air from people slowed several thinking tasks and brought on headaches and fatigue, while pure CO2 at the same level did nothing 35. Over six work days in a test office, people scored higher on a decision-making test on the days with more ventilation 155.
CO2 on its own is the unsettled part. The claim that CO2 at 1,000 ppm dulls thinking came from a 2012 chamber study of 22 people 156. Larger, later studies of pure CO2 haven't found it: not the 398-person trial at up to 4,200 ppm 157, not an eight-hour study 158, and not studies in submariners and astronaut-like volunteers 159160. So we treat CO2 as a sign of how fresh the air is, not as a toxin.
Stale air: points to an effect
Studies3 studies
22Du et al. (2020)Indoor AirPaper ↗In the strongest studies, pure CO2 at common indoor levels affected only high-level decision making (SMS battery). Lower ventilation, with CO2 and other pollutants accumulating together, could reduce speed across various functions but left accuracy unaffected.Critical review of 37 experimental studies.
35Zhang et al. (2017)Indoor AirPaper ↗Pure CO2 had no significant effect. Bioeffluents at 3,000 ppm CO2 increased headache, fatigue, sleepiness and difficulty thinking clearly, and slowed several cognitive tasks.Chamber crossover, n=25, 255 min exposures. Pure CO2 at 1,000 or 3,000 ppm was compared with ventilation restricted so that occupant bioeffluents reached the same CO2.. Limits: Short exposures and a small sample; cannot rule out effects at other durations or in vulnerable groups.
155Allen et al. (2016)Environ Health PerspectPaper ↗Cognitive scores were 61% higher on Green days and 101% higher on Green+ (high ventilation) days than on Conventional days (p<0.0001). VOCs and CO2 were each independently associated with scores.Double-blind chamber crossover, n=24, 6 full work days (COGfx Study 1). Limits: Small study and simulation outcome; large score percentages are not percentages of overall intelligence or productivity.
CO2 alone: mostly no effect
Studies5 studies
157Herbig et al. (2026)Int J Hyg Environ HealthPaper ↗Pure CO2 up to 4,200 ppm, TVOC up to 2,100 µg/m3 and cabin-altitude pressure caused no systematic cognitive decline across 8 domains. This is the largest trial to date and the strongest null.Randomized controlled trial, 398 adults in simulated flights. Limits: Short simulated-flight exposures; particular VOC mixture and healthy adults.
158Flagner et al. (2025)Indoor EnvironmentsPaper ↗Isolated CO2 at 3,000 versus 900 ppm did not robustly change cognitive performance, economic decisions or measured physiology.Randomized single-blind crossover experiment; 20 healthy adults; eight-hour exposures. Limits: Small healthy sample; test tasks may differ in difficulty from strategic simulations.
159Rodeheffer et al. (2018)Aerosp Med Hum PerformPaper ↗In 36 submariners, CO2 at 600, 2,500 or 15,000 ppm made no difference on any of the 9 SMS decision-making measures, so Satish 2012 did not replicate.Controlled exposure study, 36 submariners at 600, 2,500 and 15,000 ppm CO2.
160Scully et al. (2019)NPJ MicrogravityPaper ↗In 22 astronaut-like subjects at 600 to 5,000 ppm, there was no clear dose-response. Performance dipped at 1,200 ppm but recovered at higher levels.Controlled exposure study, 22 astronaut-like subjects at 600 to 5,000 ppm CO2.
156Satish et al. (2012)Environ Health PerspectPaper ↗Compared with 600 ppm, scores were moderately and significantly lower on 6 of 9 decision-making scales at 1,000 ppm, and much lower on 7 scales at 2,500 ppm. The authors call for confirmation.Blinded chamber crossover, n=22, ultrapure CO2 injected at 600, 1,000 and 2,500 ppm, 2.5 h sessions. Limits: Small sample and one simulation battery; later controlled studies have not consistently replicated the effect.
Counterpoints. These were short exposures in healthy adults, and the stale-air studies are small. None of them tells us much about years of stuffy nights.
What we suggest
Fresh air at night. Give bedrooms outdoor air while you sleep: a window open a crack, a vent, or mechanical ventilation. If outdoor air is noisy or polluted, a heat or energy recovery ventilator brings air in without opening windows, and in a trial these lowered indoor VOCs too 122. A CO2 monitor in the bedroom tells you how you're doing.
Exposure 5 · All year
Humidity.
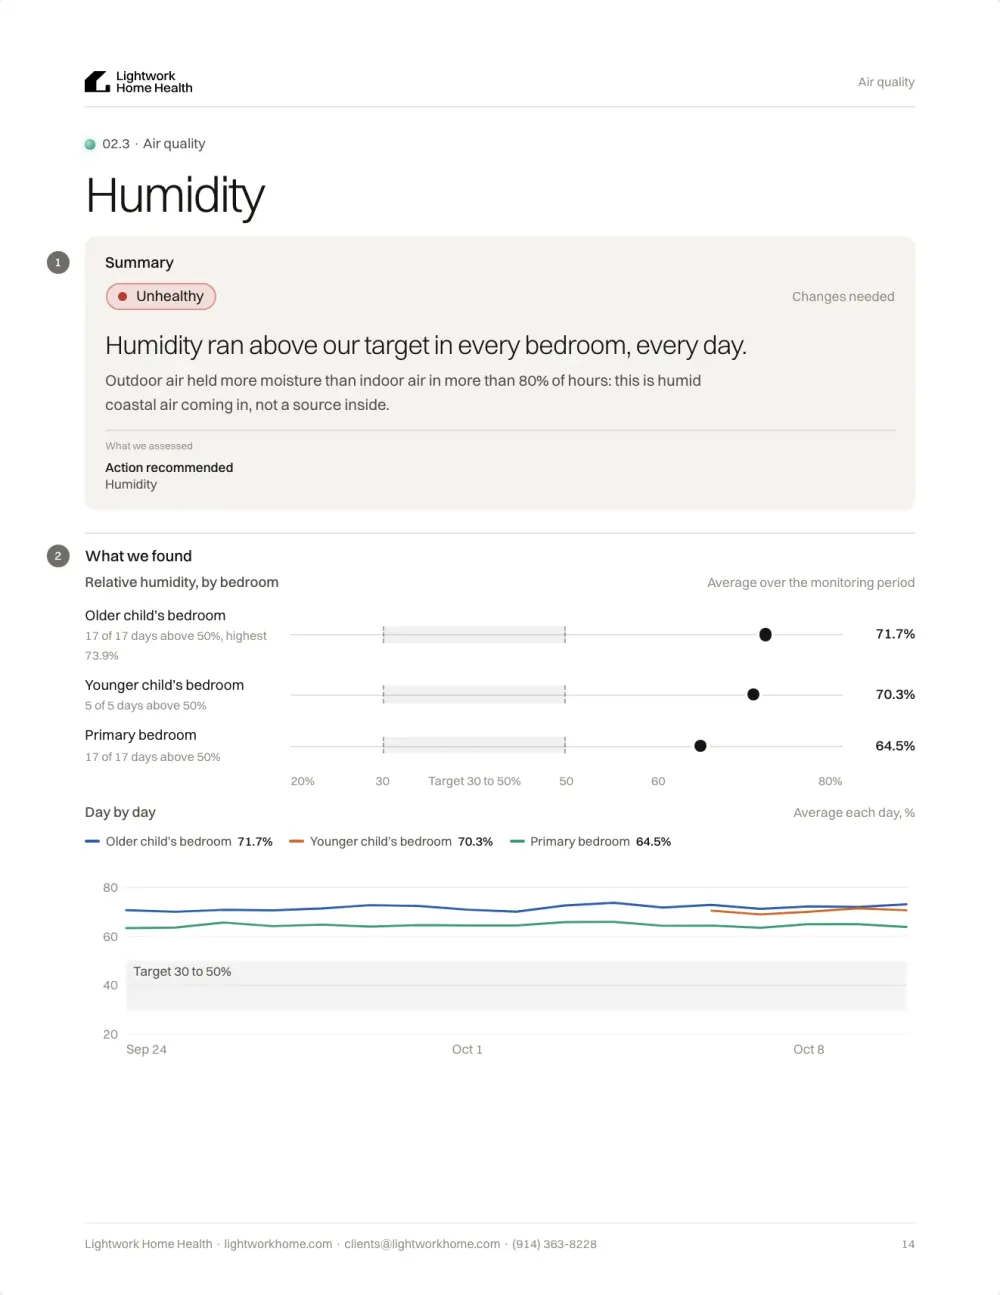
Dry winter air dries out eyes and airways and helps flu virus survive. Damp air feeds dust mites and mold. Reviews put the best range at 40 to 60% 26161, but few trials have tested it in homes.
Emerging
Flu
77%of flu virus stayed infectious in very dry air (71 to 77%), against 15 to 22% at 43% humidity or more 23
In a CDC test room with coughing manikins, flu virus kept 71 to 77% of its infectivity at 23% humidity or less, and only 15 to 22% at 43% or more, mostly lost within 15 minutes 23. Dry air helps flu spread between animals 162, and in mice it also weakened the airways' own defenses 163. In a preschool trial, humidified classrooms had less flu virus on surfaces and in the air 164.
Key studies9 studies
23Noti et al. (2013)PLoS OnePaper ↗Virus kept 70.6 to 77.3% infectivity at RH of 23% or less, but only 14.6 to 22.2% at RH of 43% or more. Most of the loss happened within 15 minutes.CDC/NIOSH simulated exam room with coughing and breathing manikins. Limits: Laboratory medium and simulated room; no human infections measured.
164Reiman et al. (2018)PLoS OnePaper ↗Humidified rooms had significantly fewer influenza A positive air and surface samples and fewer viral copies. Control rooms had 2.3 times as many influenza-like illness cases, though the authors do not know whether the link is causal.Prospective controlled trial in 4 preschool classrooms (2 humidified). Limits: Small trial in four classrooms; viral detection and illness counts do not measure person-to-person transmission.
165Shaman & Kohn (2009)PNASPaper ↗Absolute humidity explained 50% of the variability in influenza transmission and 90% of the variability in virus survival. Relative humidity explained only 12% and 36%.Reanalysis of laboratory data.
163Kudo et al. (2019)PNASPaper ↗Mice kept in dry air had worse influenza disease. Dry air impaired mucociliary clearance, antiviral interferon responses and tissue repair.Mouse study (Iwasaki lab). Limits: Animal experiment.
166Myatt et al. (2010)Environ HealthPaper ↗A bedroom humidifier raised overnight humidity by 11 to 19% and cut modeled influenza survival by 17.5 to 31.6%.Multi-zone home model.
167Verheyen & Bourouiba (2022)J R Soc InterfacePaper ↗Intermediate indoor RH (40 to 60%) was robustly associated with better COVID-19 outcomes than RH below 40% or above 60%.Ecological study of 121 countries, with indoor RH estimated from weather data.
168Kormuth et al. (2018)Journal of Infectious DiseasesPaper ↗Virus supplemented with airway-surface material remained similarly infectious for one hour across tested RH levels.Laboratory aerosol and droplet experiment; Influenza A(H1N1) with material from primary human airway cells. Limits: Laboratory study of one virus context; does not rule out humidity effects on hosts or aerosol behavior.
169Byber et al. (2021)Cochrane Database Syst RevPaper ↗One cluster RCT found less dry eye (OR 0.54, 95% CI 0.37 to 0.79, low certainty). Effects on dry nose and dry skin were not significant. No included study measured respiratory infections. Perceived stuffiness increased (OR 1.70 to 2.18).Cochrane review, 13 studies, at least 4,551 participants. Limits: Low or very low certainty; heterogeneous and often old studies.
Counterpoints. This is lab, animal, and modeling work. When virus was mixed with real airway fluid, it stayed just as infectious at every humidity 168, and no trial has shown that a humidifier at home prevents flu 169.
Emerging
Dry eyes and skin
+5ptsof humidity at the desk improved tear film and eye comfort in computer users, in a masked randomized trial 24
Below about 30% humidity, eyes and skin dry out 43. After an hour in very dry air, healthy people's tear films looked like those of dry-eye patients 170, and breathing dry air slowed the nose's clearing of mucus 171. Cold, dry weather weakens the skin barrier and can trigger eczema flares 172.
Key studies7 studies
24Wang et al. (2017)Optometry and vision science : official publication of the American Academy of OptometryPaper ↗A local RH increase of about 5 percentage points improved tear-film breakup time and subjective ocular comfort during computer use.Masked randomized crossover trial; 44 computer users; one-hour sessions. Limits: Short sessions.
170Abusharha & Pearce (2013)CorneaPaper ↗Low RH significantly worsened tear evaporation, break-up time, lipid layer, comfort and tear production. After an hour, tear films resembled those of dry eye patients.Chamber crossover, 40% vs 5% RH for 60 min. Limits: 5% RH is an extreme desiccating condition.
43Sunwoo et al. (2006)J Physiol AnthropolPaper ↗Below 30% RH, eyes and skin dried. Below 10% RH, the nasal mucosa also dried. The authors recommend keeping RH above 30% for eyes and skin.Chamber, n=16 men, 10%, 30% and 50% RH.
171Salah et al. (1988)The European respiratory journalPaper ↗Thirty minutes of dry-air breathing slowed saccharin nasal transit versus room air.Random-order controlled exposure experiment; 11 healthy nonsmokers. Limits: Small acute experiment; infection incidence and long-term outcomes were not measured.
173Arita et al. (2024)Journal of clinical medicinePaper ↗Mist exposure improved tear-film measures and ocular symptoms, with some effects persisting 1.5 hours; meibomian-gland plugging also decreased.Randomized controlled trial; 31 participants performing one hour of screen work. Limits: Small, short device-specific study; local RH rose to about 70%.
172Engebretsen et al. (2016)J Eur Acad Dermatol VenereolPaper ↗Low humidity and cold weaken the skin barrier and increase reactivity to irritants and allergens. Cold, dry weather raises the risk of atopic dermatitis flares.Review.
169Byber et al. (2021)Cochrane Database Syst RevPaper ↗One cluster RCT found less dry eye (OR 0.54, 95% CI 0.37 to 0.79, low certainty). Effects on dry nose and dry skin were not significant. No included study measured respiratory infections. Perceived stuffiness increased (OR 1.70 to 2.18).Cochrane review, 13 studies, at least 4,551 participants. Limits: Low or very low certainty; heterogeneous and often old studies.
Counterpoints. The trials lasted an hour or so, and some tested far drier air than a home. A Cochrane review rated the evidence for humidifying offices and schools low, and found people felt the air was stuffier 169.
Emerging
Dust mites and allergies
98%fewer live dust mites, 401 down to 8 per gram of dust, in homes kept below 51% humidity 25
Homes held below 51% humidity also had more than ten times less mite allergen than humid homes 25.
Key studies3 studies
25Arlian et al. (2001)J Allergy Clin ImmunolPaper ↗Homes kept below 51% RH went from 401 to 8 live mites per gram, and Der 1 allergen fell from 17 to 4 µg/g. Allergen was more than 10 times lower than in humid homes.Prospective home study over 17 months (23 low-RH homes vs 48 comparison homes). Limits: Exposure reduction only; no patient health outcome, nonrandom groups, and results depend on climate and sustained control.
26Arundel et al. (1986)Environ Health PerspectPaper ↗Pathogen survival is lowest at 40 to 70% RH. Mites are minimized below 50% and peak at 80%. Most fungi need more than 60%. Formaldehyde off-gassing rises with RH. Maintaining 40 to 60% minimizes most harms.Review.
174Singh & Jaiswal (2013)Cochrane Database Syst RevPaper ↗Dehumidification with mechanical ventilation showed no significant benefit for most asthma control measures. The double-blind trial (n=120) found no change in mite counts.Cochrane systematic review of dehumidification for asthma. Limits: Very small trial base; mechanical ventilation and dehumidification were bundled and results may not transfer to humid tropical homes.
Counterpoints. The mite study compared homes rather than randomizing them, and measured allergen, not symptoms. In the one double-blind trial of dehumidifying with ventilation, mite counts and asthma control didn't change 174.
Settled
Mold growth
60%humidity is about where most molds can start to grow 26
Mold needs moisture, and humid air supplies it: most molds need relative humidity above 60% to grow 26. WHO's guidelines on dampness and mold call preventing persistent dampness the key step 175, and dampness and mold at home are consistently linked to asthma, wheeze, cough, and respiratory infections 176.
Key studies4 studies
26Arundel et al. (1986)Environ Health PerspectPaper ↗Pathogen survival is lowest at 40 to 70% RH. Mites are minimized below 50% and peak at 80%. Most fungi need more than 60%. Formaldehyde off-gassing rises with RH. Maintaining 40 to 60% minimizes most harms.Review.
175WHO (2009)Paper ↗The most important health effects of dampness and mould are more respiratory symptoms, allergies and asthma, and disturbance of the immune system. Preventing persistent dampness is the key measure.Agency guideline.
176Mendell et al. (2011)Environ Health PerspectPaper ↗Dampness and mold are consistently linked to asthma development and exacerbation, wheeze, cough, respiratory infections, rhinitis and eczema. The evidence strongly suggests they cause asthma exacerbation in children.Comprehensive review.
177Fisk et al. (2007)Indoor AirPaper ↗Pooled ORs were 1.34 to 1.75, meaning about 30 to 50% increases in respiratory and asthma outcomes in damp or moldy homes.Meta-analysis. Limits: Prevalence associations, not individual absolute risks.
Counterpoints. The reading in the middle of a room isn't the whole story. Mold grows wherever a spot stays damp, so a leak or a cold surface can grow it in a home whose humidity reads fine.
What we suggest
Balanced humidity. A hygrometer is cheap and is straightforward to use. In dry winters, a humidifier can help, but choose carefully: an ultrasonic unit running on tap water pushed fine particles into the hundreds of µg/m³ through a whole house 178, so use distilled water in an evaporative or steam unit. Never add disinfectant to the water 179. In damp seasons, run a dehumidifier or air conditioning, and fix leaks promptly 175.
Exposure 6 · From the ground
Radon.
Radon is a naturally occurring radioactive gas from the soil. It gets into a home through cracks in the floor, gaps around pipes and cables, and sumps and drains 180. You can't see or smell it. EPA ranks it the second leading cause of lung cancer in the US, and the leading cause among people who never smoked 28.
It's measured in picocuries per liter (pCi/L) in the US and becquerels per cubic meter (Bq/m³) elsewhere; 1 pCi/L is 37 Bq/m³. Indoor air in the US averages 1.3 pCi/L, and outdoor air 0.4. EPA recommends fixing a home at 4 pCi/L or more, and considering it between 2 and 4 28. WHO's reference level is lower, at 100 Bq/m³, or 2.7 pCi/L 180.
Consistent
Lung cancer
16%higher lung cancer risk for every 100 Bq/m³ (2.7 pCi/L) of long-term radon at home 27
Across 13 European studies, lung cancer risk rose 16% for every 100 Bq/m³ of long-term radon at home, once measurement error was corrected. The rise looked linear with no threshold, and it held in homes below 200 Bq/m³ 27. Seven North American studies put it at 11% per 100 Bq/m³, in line with what studies of miners predicted 181, and among 811,961 US adults lung cancer deaths rose 15% per 100 Bq/m³ 182.
IARC has classed radon as carcinogenic to humans since 1988 183. EPA attributes about 21,000 US lung cancer deaths a year to it 28, and WHO estimates it causes between 3% and 14% of all lung cancers in a country 180.
Key studies6 studies
27Darby et al. (2005)BMJPaper ↗Lung cancer risk rose 8.4% (3.0-15.8%) per 100 Bq/m3 of measured radon, or 16% (5-31%) after correcting for measurement error. The relation looked linear with no threshold and stayed significant below 200 Bq/m3. Absolute risk by age 75 at 0, 100, and 400 Bq/m3 was about 0.4%, 0.5%, and 0.7% for lifelong non-smokers, and 10%, 12%, and 16% for smokers.Pooled analysis of individual data from 13 European case-control studies, 7,148 cases and 14,208 controls. Limits: The hazard shows in the studies collectively, not in each one separately.
181Krewski et al. (2005)EpidemiologyPaper ↗OR 1.11 (1.00-1.28) at 100 Bq/m3 over the window 5 to 30 years earlier, in line with the 1.12 (1.02-1.25) predicted from studies of miners. Estimates were higher in the subsets with more accurate radon measurement.Pooled analysis of 7 North American case-control studies, 3,662 cases and 4,966 controls. Limits: The lower confidence bound sits at 1.00.
28US EPA (2003)US EPAPaper ↗About 21,000 US lung cancer deaths a year are attributed to radon (uncertainty range 8,000 to 45,000), about 2,900 of them among people who never smoked. EPA ranks radon as the second leading cause of lung cancer overall and the leading cause among non-smokers.Agency risk assessment. Limits: A modeled estimate with a wide uncertainty range.
182Turner et al. (2011)Cancer Epidemiology, Biomarkers & PreventionPaper ↗Lung cancer mortality rose 15% (1-31%) per 100 Bq/m3. People in counties averaging above the EPA guideline (148 Bq/m3) had a 34% (7-68%) higher risk than those below it.Prospective cohort (Cancer Prevention Study-II), 811,961 adults, 3,493 lung cancer deaths. Limits: Radon was a county average, not a measurement in each home.
180WHO (2023)World Health OrganizationPaper ↗Radon is estimated to cause between 3% and 14% of all lung cancers in a country. Risk rises about 16% per 100 Bq/m3 of long-term average radon, and smokers are estimated to be 25 times more at risk from radon than non-smokers. WHO recommends a national reference level of 100 Bq/m3, and no more than 300 Bq/m3 where that cannot be reached.Agency fact sheet.
183IARC (1988)IARC MonographsPaper ↗Sufficient evidence of carcinogenicity in humans and in experimental animals. Radon and its decay products are carcinogenic to humans (Group 1).IARC Working Group evaluation.
Counterpoints. Radon and smoking multiply, so most of these cancers are in people who smoke. By age 75, a lifelong non-smoker's risk goes from about 0.4% with no radon to 0.7% at 400 Bq/m³, and a smoker's from 10% to 16% 27. None of the 13 European studies showed the effect clearly on its own; it appears when they're pooled. EPA's 21,000 is a modeled estimate, with a range of 8,000 to 45,000 28.
Consistent
Lung cancer in people who never smoked
2,900US lung cancer deaths a year attributed to radon in people who never smoked 28
Among people who never smoked, lung cancer risk rose about 15% per 100 Bq/m³ across four pooled projects. In people who had smoked it rose 9%, although the difference between the two groups was not statistically significant 184. In a Spanish pooling of never-smokers, homes at 200 Bq/m³ or more had 73% higher odds of lung cancer than homes at 100 or less 185. EPA ranks radon as the leading cause of lung cancer among non-smokers 28.
Key studies4 studies
184Cheng et al. (2021)European Respiratory ReviewPaper ↗Excess relative risk per 100 Bq/m3 was 0.15 (0.06-0.25) for never-smokers and 0.09 (0.03-0.16) for ever-smokers, not significantly different (p=0.32). Among never-smokers it was 0.46 (0.15-0.76) for men and 0.09 (-0.02 to 0.20) for women.Meta-analysis of 4 pooled studies (24 case-control studies), 2,341 never-smoker cases and 8,967 never-smoker controls. Limits: The estimate for never-smoking women was not statistically significant.
185Lorenzo-González et al. (2019)Environmental ResearchPaper ↗OR 1.73 (1.27-2.35) for homes at 200 Bq/m3 or more compared with 100 Bq/m3 or less, and OR 1.52 (1.14-2.02) for adenocarcinoma.Pooled case-control studies of never-smokers, 523 cases and 892 controls. Limits: Hospital-based controls from one region.
27Darby et al. (2005)BMJPaper ↗Lung cancer risk rose 8.4% (3.0-15.8%) per 100 Bq/m3 of measured radon, or 16% (5-31%) after correcting for measurement error. The relation looked linear with no threshold and stayed significant below 200 Bq/m3. Absolute risk by age 75 at 0, 100, and 400 Bq/m3 was about 0.4%, 0.5%, and 0.7% for lifelong non-smokers, and 10%, 12%, and 16% for smokers.Pooled analysis of individual data from 13 European case-control studies, 7,148 cases and 14,208 controls. Limits: The hazard shows in the studies collectively, not in each one separately.
28US EPA (2003)US EPAPaper ↗About 21,000 US lung cancer deaths a year are attributed to radon (uncertainty range 8,000 to 45,000), about 2,900 of them among people who never smoked. EPA ranks radon as the second leading cause of lung cancer overall and the leading cause among non-smokers.Agency risk assessment. Limits: A modeled estimate with a wide uncertainty range.
Counterpoints. The absolute risk is small: for a lifelong non-smoker it stays under 1% by age 75, even at 400 Bq/m³ 27. In the pooled projects, the estimate for women who never smoked wasn't statistically significant 184. The Spanish study drew its controls from hospitals in one region 185.
Unsettled
Childhood leukemia
22%higher odds of childhood leukemia in case-control studies, but no increase in cohort studies 29
In a Danish registry study of 2,400 children with cancer, acute lymphoblastic leukemia rose with the radon a child had lived with, to 63% higher at the highest exposure, and no other childhood cancer was linked 186. Eight case-control studies together put the odds of childhood leukemia 22% higher 29.
The studies that followed children forward found nothing: two cohort studies pooled to no increase 29, and a national Swiss cohort found no link to leukemia or to any childhood cancer 187.
Points to a risk
Studies2 studies
186Raaschou-Nielsen et al. (2008)EpidemiologyPaper ↗Cumulative radon exposure was associated with acute lymphoblastic leukemia: rate ratio 1.21 (0.98-1.49) at mid exposure and 1.63 (1.05-2.53) at the highest, a 56% increase per 1,000 Bq/m3-years. No association was found with other childhood cancers.Registry-based case-control study in Denmark, 2,400 cases and 6,697 controls. Limits: Radon was calculated for each address, not measured.
29Lu et al. (2020)Journal of BUONPaper ↗A weak positive association in case-control studies, summary OR 1.22 (1.01-1.42), but none in cohort studies, summary HR 0.97 (0.81-1.15).Meta-analysis of 8 case-control studies (10,803 cases, 16,202 controls) and 2 cohort studies (1,428 cases). Limits: The association appears only in the case-control studies.
Points the other way
Studies1 study
187Hauri et al. (2013)Environmental Health PerspectivesPaper ↗Comparing the top 10% of radon exposure (139.9 Bq/m3 or more) with below the median (under 77.7 Bq/m3): HR 0.93 (0.74-1.16) for all cancers, 0.95 (0.63-1.43) for all leukemias, 0.90 (0.56-1.43) for acute lymphoblastic leukemia, and 1.05 (0.68-1.61) for CNS tumors.Nationwide census-based cohort of Swiss children under 16, 997 cancer cases. Limits: Radon was modeled for each address from about 45,000 measurements.
Counterpoints. In both the Danish and the Swiss study, radon was calculated for each address, not measured in the home 186187. The link shows up only in the case-control studies 29.
Emerging
Stroke and COPD
14%higher stroke risk for women living where radon averaged above 4 pCi/L than where it averaged under 2 30
Among 158,910 women followed for about 13 years, those living where radon averaged above 4 pCi/L had a 14% higher risk of stroke than those where it averaged under 2 30. Among 811,961 US adults, deaths from COPD rose 13% per 100 Bq/m³ 188.
Key studies2 studies
30Buchheit et al. (2024)NeurologyPaper ↗Compared with under 2 pCi/L, stroke risk was HR 1.06 (0.99-1.13) at 2 to 4 pCi/L and 1.14 (1.05-1.22) above 4 pCi/L. Spline models showed elevated risk between 2 and 4 pCi/L, below the EPA action level.Prospective cohort (Women's Health Initiative), 158,910 women, 6,979 strokes over a mean 13.4 years. Limits: Radon was a US Geological Survey estimate for the area, not a home measurement; postmenopausal women only.
188Turner et al. (2012)European Respiratory JournalPaper ↗COPD mortality rose with radon, HR 1.13 (1.05-1.21) per 100 Bq/m3, with a significant linear trend.Prospective cohort (Cancer Prevention Study-II), 811,961 adults, 28,300 non-malignant respiratory deaths. Limits: County-average radon; the authors say the finding needs confirmation.
Counterpoints. Both studies used the average radon for the area, not a measurement in each home, so they can't separate radon from other things that vary by region. The COPD study's authors say their finding needs confirmation 188. In the stroke study, the 6% rise between 2 and 4 pCi/L was not statistically significant 30.
What we suggest
Test for radon.EPA says all homes should be tested. Small passive detectors are inexpensive, and work best left in place for at least three months 180. At 4 pCi/L or more, EPA recommends fixing the home, and considering it between 2 and 4 28.
Our approach
We measure the air in every room.
Outdoor air changes every day, so a single indoor number doesn't tell you much. We compare each room with the outdoor air on the same visit, look for the sources inside, and leave monitors beside beds to see what happens overnight.
From a recent homeUltrafine particles the home's HVAC system wasn't catching.
The smallest particles, linked to respiratory and cardiovascular problems and allergic reactions.
From a recent homeA combustion gas leak from a dryer.
An immediate risk.
What we measure
Six readings for the air.
Indoors versus outdoors
Particles by size
Particle counts in six sizes, 0.3 to 10 µm, in every room you spend time in, compared with outdoor air on the same visit, plus PM2.5 logged overnight in the bedrooms.
What adds particles
Particle sources
We disturb likely sources, like couches, carpets, drapes, and beds, and measure again, to see whether anything in the house is adding to the air.
How fresh the air is
CO2
Measured through the home and logged overnight beside beds, as a marker of ventilation.
How damp or dry
Relative humidity
Logged overnight beside beds, and compared with outdoor humidity to tell whether moisture is coming in or being made inside.
Chemical vapors
VOCs
Continuous monitors in the bedrooms show when VOCs rise, from cleaning or personal care products or new furnishings, and how quickly they clear.
Combustion
Gas leaks and CO
Every gas appliance, pipeline, and fitting checked for leaks, and the whole home for carbon monoxide. Zero is the right level for both.
How a visit works
We find the sources and make a plan
Walk every room
Purifiers and their settings, HVAC filters, the stove and hood, gas appliances, the garage, and what's under the sink.
Measure inside and out
Particles outdoors at the start and end, and in every room where you spend time.
Test the sources
Disturb likely particle sources, and check every gas appliance and fitting for leaks and CO.
Watch the nights
Monitors beside beds log CO2, humidity, VOCs, and fine particles over the following days.
Give you a plan
Purifier sizes and settings, a filter schedule, and fixes for ventilation, humidity, and products, in order of impact.
What you get
Your results, room by room and night by night, in your Lightwork report.
Find out what's in the air in your home.
We walk through your home, measure the air room by room and overnight in the bedrooms, and give you a short list of changes, along with everything else we test in your home.
1Lunderberg et al. (2023). Assessing residential PM2.5 concentrations and infiltration factors with high spatiotemporal resolution using crowdsourced sensors. PNAS. Paired indoor/outdoor PurpleAir monitors in 3,977 US homes, more than 10,000 monitor-years. Paper ↗
2Farmer et al. (2019). Overview of HOMEChem: House Observations of Microbial and Environmental Chemistry. Environ Sci Process Impacts. Field campaign in a research house, with cooking, cleaning, occupancy and window-opening experiments. Paper ↗
3Walzer et al. (2020). Effects of Home Particulate Air Filtration on Blood Pressure: A Systematic Review. Hypertension. Systematic review and meta-analysis, 10 trials, n=604. Paper ↗
4Gauderman et al. (2015). Association of improved air quality with lung development in children. N Engl J Med. Children's Health Study, three cohorts, n=2,120 children. Paper ↗
5Best Rogowski et al. (2025). Long-term air pollution exposure and incident dementia: a systematic review and meta-analysis. Lancet Planet Health. Meta-analysis, 32 studies; PM2.5 analysis 21 studies, n=24,030,527. Paper ↗
6Ghosh et al. (2021). Ambient and household PM2.5 pollution and adverse perinatal outcomes: A meta-regression and analysis of attributable global burden for 204 countries and territories. PLoS Med. Meta-regression (44 birth weight, 40 LBW, 40 PTB studies) plus global burden estimate. Paper ↗
7Barn et al. (2018). The effect of portable HEPA filter air cleaner use during pregnancy on fetal growth: The UGAAR randomized controlled trial. Environ Int. RCT, n=540 pregnant women, Ulaanbaatar, Mongolia. Paper ↗
8Sircar et al. (2015). Carbon monoxide poisoning deaths in the United States, 1999 to 2012. Am J Emerg Med. CDC national death-record surveillance. Paper ↗
9Pilotto et al. (2004). Randomized controlled trial of unflued gas heater replacement on respiratory health of asthmatic schoolchildren. Int J Epidemiol. Cluster RCT in 18 Australian schools (45 intervention and 73 control children with asthma). Paper ↗
10Lin et al. (2013). Meta-analysis of the effects of indoor nitrogen dioxide and gas cooking on asthma and wheeze in children. Int J Epidemiol. Meta-analysis of 41 studies. Paper ↗
11Puzzolo et al. (2024). Estimated health effects from domestic use of gaseous fuels for cooking and heating in high-income, middle-income, and low-income countries: a systematic review and meta-analyses. Lancet Respir Med. WHO-funded systematic review and meta-analysis of 116 studies. Paper ↗
12Lebel et al. (2022). Composition, Emissions, and Air Quality Impacts of Hazardous Air Pollutants in Unburned Natural Gas from Residential Stoves in California. Environ Sci Technol. 185 unburned gas samples from 159 home stoves in 7 California regions. Paper ↗
13Baan et al. (IARC) (2009). A review of human carcinogens, Part F: chemical agents and related occupations. Lancet Oncol. IARC Monograph 100F summary. Paper ↗
14Loomis et al. (IARC) (2017). Carcinogenicity of benzene. Lancet Oncol. IARC Monograph 120 summary. Paper ↗
15Zock et al. (2007). The use of household cleaning sprays and adult asthma: an international longitudinal study. Am J Respir Crit Care Med. ECRHS prospective cohort, 3,503 asthma-free adults across 10 countries. Paper ↗
16Nurmatov et al. (2015). Volatile organic compounds and risk of asthma and allergy: a systematic review. Eur Respir Rev. Systematic review, 53 studies. Paper ↗
17Steinemann (2016). Fragranced consumer products: exposures and effects from emissions. Air Qual Atmos Health. Nationally representative US online survey (n=1,136). Paper ↗
18Bailey et al. (2015). Home paint exposures and risk of childhood acute lymphoblastic leukemia: findings from the Childhood Leukemia International Consortium. Cancer Causes Control. Pooled individual data from 8 case-control studies (up to 4,382 cases). Paper ↗
19Yan et al. (2022). Experimental study of the negative effects of raised bedroom temperature and reduced ventilation on the sleep quality of elderly subjects. Indoor Air. 2x2 experimental bedroom study, n=16 adults over 65, full polysomnography (EEG, EOG, EMG, ECG). Paper ↗
20Milton et al. (2000). Risk of sick leave associated with outdoor air supply rate, humidification, and occupant complaints. Indoor Air. Cohort, 3,720 employees in 40 buildings. Paper ↗
21Fisk et al. (2009). Quantitative relationship of sick building syndrome symptoms with ventilation rates. Indoor Air. Pooled analysis of published studies. Paper ↗
22Du et al. (2020). Indoor CO2 concentrations and cognitive function: A critical review. Indoor Air. Critical review of 37 experimental studies. Paper ↗
23Noti et al. (2013). High humidity leads to loss of infectious influenza virus from simulated coughs. PLoS One. CDC/NIOSH simulated exam room with coughing and breathing manikins. Paper ↗
24Wang et al. (2017). Randomized Trial of Desktop Humidifier for Dry Eye Relief in Computer Users. Optometry and vision science : official publication of the American Academy of Optometry. Masked randomized crossover trial; 44 computer users; one-hour sessions. Paper ↗
25Arlian et al. (2001). Reducing relative humidity is a practical way to control dust mites and their allergens in homes in temperate climates. J Allergy Clin Immunol. Prospective home study over 17 months (23 low-RH homes vs 48 comparison homes). Paper ↗
26Arundel et al. (1986). Indirect health effects of relative humidity in indoor environments. Environ Health Perspect. Review. Paper ↗
27Darby et al. (2005). Radon in homes and risk of lung cancer: collaborative analysis of individual data from 13 European case-control studies. BMJ. Pooled analysis of individual data from 13 European case-control studies, 7,148 cases and 14,208 controls. Paper ↗
28US EPA (2003). EPA Assessment of Risks from Radon in Homes (EPA 402-R-03-003). US EPA. Agency risk assessment. Paper ↗
29Lu et al. (2020). Domestic radon exposure and risk of childhood leukemia: A meta-analysis. Journal of BUON. Meta-analysis of 8 case-control studies (10,803 cases, 16,202 controls) and 2 cohort studies (1,428 cases). Paper ↗
30Buchheit et al. (2024). Radon Exposure and Incident Stroke Risk in the Women's Health Initiative. Neurology. Prospective cohort (Women's Health Initiative), 158,910 women, 6,979 strokes over a mean 13.4 years. Paper ↗
31Wallace et al. (2004). Source strengths of ultrafine and fine particles due to cooking with a gas stove. Environ Sci Technol. 18 months of measurements in an occupied house. Paper ↗
32Kumar et al. (2023). Critical review on emerging health effects associated with the indoor air quality and its sustainable management. Sci Total Environ. Critical review. Paper ↗
33Maher et al. (2016). Magnetite pollution nanoparticles in the human brain. PNAS. Mechanistic, magnetic analysis and electron microscopy of human brain tissue. Paper ↗
34Zhang et al. (2025). Enhancing indoor air quality and cardiopulmonary health in patients with asthma by photocatalytic oxidation and filters air cleaner. J Hazard Mater. Randomized double-blind crossover trial in homes of adults with asthma. Paper ↗
35Zhang et al. (2017). Effects of exposure to carbon dioxide and bioeffluents on perceived air quality, self-assessed acute health symptoms, and cognitive performance. Indoor Air. Chamber crossover, n=25, 255 min exposures. Pure CO2 at 1,000 or 3,000 ppm was compared with ventilation restricted so that occupant bioeffluents reached the same CO2.. Paper ↗
36Bennett et al. (2026). Stuffy nights: elevated bedroom carbon dioxide concentrations indicate inadequate ventilation in Wellington homes. N Z Med J. Pilot exposure study, 20 bedrooms, each monitored for 2 weeks. Paper ↗
37Strøm-Tejsen et al. (2016). The effects of bedroom air quality on sleep and next-day performance. Indoor Air. Two field crossover interventions in dorm rooms (n=14 and n=16), each condition lasting 1 week, sleep measured by actigraphy. Paper ↗
38Wang et al. (2023). The Influence of Bedroom CO2 Concentration on Sleep Quality. Buildings. Experimental bedroom, n=10 subjects, 30 PSG nights; average CO2 of 680, 920 and 1,350 ppm, simulating 1, 2 and 3 sleepers. Paper ↗
39Fan et al. (2022). A field intervention study of the effects of window and door opening on bedroom IAQ, sleep quality, and next-day cognitive performance. Build Environ. Field crossover in 40 real Danish bedrooms over 2 weeks; 29 bedrooms had an effective intervention (95th percentile CO2 changed by more than 200 ppm). Paper ↗
40Mishra et al. (2018). Window/door opening-mediated bedroom ventilation and its impact on sleep quality of healthy, young adults. Indoor Air. Field study, n=17, 5 days, actigraphy plus questionnaires. Paper ↗
41Marr et al. (2019). Mechanistic insights into the effect of humidity on airborne influenza virus survival, transmission and incidence. J R Soc Interface. Perspective and reanalysis. Paper ↗
42Parthasarathy et al. (2011). Effect of temperature and humidity on formaldehyde emissions in temporary housing units. J Air Waste Manag Assoc. Chamber tests of composite wood from FEMA trailers. Paper ↗
43Sunwoo et al. (2006). Physiological and subjective responses to low relative humidity. J Physiol Anthropol. Chamber, n=16 men, 10%, 30% and 50% RH. Paper ↗
44GBD 2021 Risk Factors Collaborators (2024). Global burden and strength of evidence for 88 risk factors in 204 countries and 811 subnational locations, 1990-2021. Lancet. Global Burden of Disease systematic analysis. Paper ↗
45Faridi et al. (2023). An updated systematic review and meta-analysis on portable air cleaners and blood pressure: Recommendations for users and manufacturers. Ecotoxicol Environ Saf. Meta-analysis, 17 true-vs-sham trials, ~880 participants. Paper ↗
46Morishita et al. (2018). Effect of Portable Air Filtration Systems on Personal Exposure to Fine Particulate Matter and Blood Pressure Among Residents in a Low-Income Senior Facility: A Randomized Clinical Trial. JAMA Intern Med. Randomized double-blind crossover, n=40 older adults, Detroit. Paper ↗
47Brook et al. (2026). Bedroom Air Filtration and Home Blood Pressures of Older Adults Living in a Residential Facility. J Clin Hypertens. Randomized double-blind crossover, n=33 older adults, 4 weeks per arm. Paper ↗
48Brook et al. (2010). Particulate matter air pollution and cardiovascular disease: An update to the scientific statement from the American Heart Association. Circulation. AHA scientific statement. Paper ↗
49Rajagopalan et al. (2020). Personal-Level Protective Actions Against Particulate Matter Air Pollution Exposure: A Scientific Statement From the American Heart Association. Circulation. AHA scientific statement on personal interventions (air purifiers, masks, etc.). Paper ↗
50Miller et al. (2007). Long-term exposure to air pollution and incidence of cardiovascular events in women. N Engl J Med. Women's Health Initiative cohort, n=65,893 postmenopausal women. Paper ↗
51Allen et al. (2011). An air filter intervention study of endothelial function among healthy adults in a woodsmoke-impacted community. Am J Respir Crit Care Med. Randomized crossover, n=45 healthy adults, 7-day periods. Paper ↗
52Soppa et al. (2017). Arterial blood pressure responses to short-term exposure to fine and ultrafine particles from indoor sources: A randomized sham-controlled exposure study of healthy volunteers. Environ Res. Randomized sham-controlled crossover, n=54 (candles, toasting bread, frying sausages). Paper ↗
53Brugge et al. (2025). Effect of HEPA Filtration Air Purifiers on Blood Pressure: A Pragmatic Randomized Crossover Trial. Journal of the American College of Cardiology. Pragmatic randomized crossover trial; 154 adults living near highways. Paper ↗
54Keleb et al. (2025). The odds of developing asthma and wheeze among children and adolescents exposed to particulate matter: a systematic review and meta-analysis. BMC Public Health. Meta-analysis, 47 studies, n=417,874 children. Paper ↗
55Park et al. (2021). Impact of long-term exposure to ambient air pollution on the incidence of chronic obstructive pulmonary disease: A systematic review and meta-analysis. Environ Res. Meta-analysis of 7 prospective studies. Paper ↗
56Lanphear et al. (2011). Effects of HEPA air cleaners on unscheduled asthma visits and asthma symptoms for children exposed to secondhand tobacco smoke. Pediatrics. Double-blind RCT, n=225 children with asthma. Paper ↗
57Butz et al. (2011). A randomized trial of air cleaners and a health coach to improve indoor air quality for inner-city children with asthma and secondhand smoke exposure. Arch Pediatr Adolesc Med. RCT, n=126 children. Paper ↗
58Hansel et al. (2022). Randomized Clinical Trial of Air Cleaners to Improve Indoor Air Quality and Chronic Obstructive Pulmonary Disease Health: Results of the CLEAN AIR Study. American Journal of Respiratory and Critical Care Medicine. Six-month blinded randomized trial; 116 former smokers with moderate-to-severe COPD randomized. Paper ↗
59Aguilera et al. (2021). Fine Particles in Wildfire Smoke and Pediatric Respiratory Health in California. Pediatrics. Time-series of pediatric ER/urgent care visits, San Diego, 2011 to 2017. Paper ↗
60Livingston et al. (2024). Dementia prevention, intervention, and care: 2024 report of the Lancet standing Commission. Lancet. Lancet Commission review. Paper ↗
61Zhang et al. (2025). Lewy body dementia promotion by air pollutants. Science. Medicare cohort of 56.5 million plus mouse experiments. Paper ↗
62Faherty et al. (2025). Acute particulate matter exposure diminishes executive cognitive functioning after four hours regardless of inhalation pathway. Nature Communications. Controlled within-person crossover experiment; 26 adults. Paper ↗
63Zhou et al. (2026). Short-term indoor fine particulate matter exposure impedes cognitive performance and autonomic nervous system in adults. iScience. Randomized single-blind crossover experiment; 90 working-age adults. Paper ↗
64Wilker et al. (2023). Ambient air pollution and clinical dementia: systematic review and meta-analysis. BMJ. Meta-analysis, 51 studies (14 for PM2.5). Paper ↗
65Bekkar et al. (2020). Association of Air Pollution and Heat Exposure With Preterm Birth, Low Birth Weight, and Stillbirth in the US: A Systematic Review. JAMA Netw Open. Systematic review, 68 studies, 32.8 million US births. Paper ↗
66Ulziikhuu et al. (2022). Portable HEPA Filter Air Cleaner Use during Pregnancy and Children's Cognitive Performance at Four Years of Age: The UGAAR Randomized Controlled Trial. Environ Health Perspect. RCT follow-up, 475 children at age 4. Paper ↗
67Clasen et al. (HAPIN trial) (2022). Liquefied Petroleum Gas or Biomass for Cooking and Effects on Birth Weight. N Engl J Med. Randomized trial, 3,200 pregnant women in four countries. Paper ↗
68Patel et al. (2020). Indoor Particulate Matter during HOMEChem: Concentrations, Size Distributions, and Exposures. Environ Sci Technol. Controlled test-house campaign of everyday activities. Paper ↗
69Xiang et al. (2021). Characterization of cooking-related ultrafine particles in a US residence and impacts of various intervention strategies. Sci Total Environ. Standardized cooking experiments in a real apartment. Paper ↗
70Liang et al. (2021). Wildfire smoke impacts on indoor air quality assessed using crowdsourced data in California. PNAS. Indoor/outdoor sensor data from more than 1,400 California buildings. Paper ↗
71Friborg et al. (2008). Incense use and respiratory tract carcinomas: a prospective cohort study. Cancer. Singapore Chinese Health Study cohort, n=61,320. Paper ↗
72Belanger et al. (2006). Association of indoor nitrogen dioxide exposure with respiratory symptoms in children with asthma. Am J Respir Crit Care Med. Cohort of children with asthma, with home NO2 measured by Palmes tubes. Paper ↗
73Johnson et al. (2026). Characterizing household air pollutant concentrations associated with an electrification program in the rural San Joaquin Valley. Environ Res Health. Cross-sectional study of 138 low-income rural California homes. Paper ↗
74Sehgal et al. (2026). Asthma Control Before and After Changing Gas Stoves to Electric Stoves. J Allergy Clin Immunol Pract. Before-after study (no control group), n=85 people in Cleveland with poorly controlled asthma. Paper ↗
75Kashtan et al. (2024). Nitrogen dioxide exposure, health outcomes, and associated demographic disparities due to gas and propane combustion by U.S. stoves. Sci Adv. Measurements in more than 100 homes, combined with a room-specific indoor air model and national housing and behavior sampling. Paper ↗
76Hampson (2023). Carbon monoxide poisoning mortality in the United States from 2015-2021. Clin Toxicol. CDC WONDER mortality analysis. Paper ↗
77Stearns & Sircar (2019). National unintentional carbon monoxide poisoning estimates using hospitalization and emergency department data. Am J Emerg Med. CDC analysis of national inpatient and ED databases. Paper ↗
78Rose et al. (2017). Carbon Monoxide Poisoning: Pathogenesis, Management, and Future Directions of Therapy. Am J Respir Crit Care Med. Narrative clinical review. Paper ↗
79Weaver et al. (2002). Hyperbaric oxygen for acute carbon monoxide poisoning. N Engl J Med. Double-blind RCT, n=152. Paper ↗
80Zhang et al. (2024). Increased Long-Term Risk of Dementia in Patients With Carbon Monoxide Poisoning: A Systematic Review and Meta-Analysis of Cohort Studies. Psychiatry Investig. Meta-analysis of 3 cohorts (n=134,563, follow-up 9 to 12 years). Paper ↗
81Huang et al. (2021). Increased Risk of Congestive Heart Failure Following Carbon Monoxide Poisoning. Circ Heart Fail. Taiwan national cohort (20,942 CO patients vs 62,826 controls) plus a rat model. Paper ↗
82Allred et al. (1989). Short-term effects of carbon monoxide exposure on the exercise performance of subjects with coronary artery disease. N Engl J Med. Randomized, double-blind exposure study, n=63 men with coronary artery disease. Paper ↗
83Heckerling (1987). Occult carbon monoxide poisoning: a cause of winter headache. Am J Emerg Med. ED case series, n=37 patients with headache during heating season. Paper ↗
84Choi (1983). Delayed neurologic sequelae in carbon monoxide intoxication. Arch Neurol. Case series of 2,360 CO victims in Korea (many exposed through home heating). Paper ↗
85Belanger et al. (2013). Household levels of nitrogen dioxide and pediatric asthma severity. Epidemiology. Prospective year-long cohort, n=1,342 children aged 5 to 10 with asthma (Connecticut, Massachusetts), with repeated home NO2 measurements. Paper ↗
86Marks et al. (2010). Respiratory health effects of exposure to low-NOx unflued gas heaters in the classroom: a double-blind, cluster-randomized, crossover study. Environmental health perspectives. Double-blind cluster randomized crossover trial; 400 primary-school students in 22 schools. Paper ↗
87Howden-Chapman et al. (2008). Effects of improved home heating on asthma in community dwelling children: randomised controlled trial. BMJ. Randomized controlled trial; 409 children ages 6–12 with asthma in New Zealand. Paper ↗
88Paulin et al. (2014). Home interventions are effective at decreasing indoor nitrogen dioxide concentrations. Indoor Air. Three-arm randomized trial in Baltimore homes with unvented gas stoves. Paper ↗
89Hansel et al. (2008). A longitudinal study of indoor nitrogen dioxide levels and respiratory symptoms in inner-city children with asthma. Environ Health Perspect. Longitudinal cohort, n=150 preschool children with asthma in Baltimore, with bedroom NO2 monitoring. Paper ↗
90Jarvis et al. (1996). Association of respiratory symptoms and lung function in young adults with use of domestic gas appliances. Lancet. Population sample of adults aged 20 to 44 in East Anglia, UK (659 women, 500 men interviewed). Paper ↗
91Pan et al. (2024). Gas cooking indoors and respiratory symptoms in the ECRHS cohort. Int J Hyg Environ Health. Repeated surveys about 11 years apart, n=4,337 adults in 19 centres across 9 countries. Paper ↗
92Casas et al. (2012). Association of gas cooking with children's respiratory health: results from GINIplus and LISAplus birth cohort studies. Int J Hyg Environ Health. Birth cohort (GINIplus/LISAplus), 5,078 children followed to age 10. Paper ↗
93Li et al. (2023). Gas cooking and respiratory outcomes in children: A systematic review. Glob Epidemiol. Systematic review of 66 studies by consultants with disclosed gas-industry ties. Paper ↗
94Lebel et al. (2022). Methane and NOx Emissions from Natural Gas Stoves, Cooktops, and Ovens in Residential Homes. Environ Sci Technol. Methane measured in 53 homes and NOx in 32 homes. Paper ↗
95Kashtan et al. (2023). Gas and Propane Combustion from Stoves Emits Benzene and Increases Indoor Air Pollution. Environ Sci Technol. Emissions measurements in 87 homes (California, Colorado). Paper ↗
96Michanowicz et al. (2022). Home is Where the Pipeline Ends: Characterization of Volatile Organic Compounds Present in Natural Gas at the Point of the Residential End User. Environ Sci Technol. 234 gas samples from 69 homes in Greater Boston. Paper ↗
97Sparks et al. (2026). Benzene and other hazardous air pollutants in consumer-grade natural gas in Europe. Environ Res Lett. Stove-off leak measurements in 35 homes and 78 gas samples from 7 cities (UK, Netherlands, Italy). Paper ↗
98Garg et al. (2025). Exposure and health risks of benzene from combustion by gas stoves: A modelling approach in U.S. homes. J Hazard Mater. Multizone indoor air model (NIST CONTAM) across 24 floorplans, focused on the 6.3 million US residents with the top 5% highest-emitting stoves. Paper ↗
99Tam et al. (2026). Toxic Air Contaminant Emissions from Residential and Commercial Fossil Gas Appliances: A Systematic Review. Curr Environ Health Rep. Systematic review of 25 studies. Paper ↗
100Yoon et al. (1998). Deaths from unintentional carbon monoxide poisoning and potential for prevention with carbon monoxide detectors. JAMA. Descriptive analysis of 136 New Mexico CO deaths (1980 to 1995). Paper ↗
101Hampson (2022). Comparison of four low-level carbon monoxide alarms suitable for home use or when traveling. Undersea Hyperb Med. Bench test of 4 brands of low-level alarm. Paper ↗
102CDC (2005). Carbon monoxide poisoning from hurricane-associated use of portable generators, Florida, 2004. MMWR. Public health investigation (6 deaths, 167 non-fatal cases). Paper ↗
103Holm et al. (2025). Measured air quality impacts after teaching parents about cooking ventilation with a video: a pilot study. J Expo Sci Environ Epidemiol. Before-after pilot, n=14 Bay Area homes with gas stoves and school-aged children. Paper ↗
104Kile et al. (2014). A cross-sectional study of the association between ventilation of gas stoves and chronic respiratory illness in U.S. children enrolled in NHANES III. Environ Health. Cross-sectional study of US children aged 2 to 16 in gas-stove homes. Paper ↗
105Daouda et al. (2024). Out of Gas, In with Justice: Findings from a gas-to-induction pilot in low-income housing in NYC. Energy Research & Social Science. Randomized pilot in 20 Bronx public housing households (induction stove vs keeping gas). Paper ↗
106Wolkoff (2020). Indoor air chemistry: Terpene reaction products and airway effects. Int J Hyg Environ Health. Review (human and rodent exposure data). Paper ↗
107Patra et al. (2025). Flame-Free Candles Are Not Pollution-Free: Scented Wax Melts as a Significant Source of Atmospheric Nanoparticles. Environ Sci Technol Lett. Field measurements in a residential test house. Paper ↗
108US EPA IRIS (2024). Toxicological Review of Formaldehyde: Inhalation (final). IRIS assessment. Agency systematic review. Paper ↗
109Garrett et al. (1999). Increased risk of allergy in children due to formaldehyde exposure in homes. Allergy. 148 children aged 7 to 14 in 80 homes, formaldehyde measured 4 times over a year. Paper ↗
110WHO (2010). WHO guidelines for indoor air quality: selected pollutants. WHO Regional Office for Europe. Agency guideline. Paper ↗
111Beane Freeman et al. (2013). Mortality from solid tumors among workers in formaldehyde industries: an update of the NCI cohort. Am J Ind Med. Cohort of 25,619 workers followed through 2004. Paper ↗
112Hauptmann et al. (2009). Mortality from lymphohematopoietic malignancies and brain cancer among embalmers exposed to formaldehyde. J Natl Cancer Inst. Case-control study within the funeral industry (168 lymphohematopoietic cases, 48 brain tumor cases, 265 controls). Paper ↗
113Lan et al. (2004). Hematotoxicity in workers exposed to low levels of benzene. Science. Cross-sectional study of 250 exposed workers and 140 controls. Paper ↗
114Coggon et al. (2014). Upper airway cancer, myeloid leukemia, and other cancers in a cohort of British chemical workers exposed to formaldehyde. American journal of epidemiology. Occupational cohort with nested case-control analyses; 14,008 British chemical workers followed through 2012. Paper ↗
115Vincent et al. (2024). Assessment of associations between inhaled formaldehyde and lymphohematopoietic cancer through the integration of epidemiological and toxicological evidence with biological plausibility. Toxicol Sci. Systematic review and meta-analysis of formaldehyde and blood cancers. Paper ↗
116Carlos-Wallace et al. (2016). Parental, In Utero, and Early-Life Exposure to Benzene and the Risk of Childhood Leukemia: A Meta-Analysis. Am J Epidemiol. Meta-analysis (20 studies of occupational or household product exposure; 12 traffic studies). Paper ↗
117Beane Freeman et al. (2009). Mortality from lymphohematopoietic malignancies among workers in formaldehyde industries: the National Cancer Institute Cohort. J Natl Cancer Inst. Same NCI cohort, median follow-up 42 years. Paper ↗
118Pál et al. (2024). Exposure to volatile organic compounds in offices and in residential and educational buildings in the European Union between 2010 and 2023: A systematic review and health risk assessment. The Science of the total environment. Systematic review of concentrations and probabilistic risk assessment; 58 European indoor-air studies yielding relevant exposure data. Paper ↗
119Svanes et al. (2018). Cleaning at Home and at Work in Relation to Lung Function Decline and Airway Obstruction. Am J Respir Crit Care Med. ECRHS cohort, 6,235 participants followed over 20 years. Paper ↗
120Lam et al. (2021). Exposure to formaldehyde and asthma outcomes: A systematic review, meta-analysis, and economic assessment. PLoS One. Navigation Guide systematic review (150 human studies; 10 combined for childhood asthma diagnosis). Paper ↗
121Franck et al. (2014). Prenatal VOC exposure and redecoration are related to wheezing in early infancy. Environ Int. LINA birth cohort, with indoor VOCs measured during pregnancy and at age 1. Paper ↗
122Lajoie et al. (2015). The IVAIRE project: a randomized controlled study of the impact of ventilation on indoor air quality and the respiratory symptoms of asthmatic children in single family homes. Indoor Air. RCT, 83 children with asthma (43 intervention, 40 control), using heat- or energy-recovery ventilators. Paper ↗
123Venn et al. (2003). Effects of volatile organic compounds, damp, and other environmental exposures in the home on wheezing illness in children. Thorax. Home-measurement case-control study; 193 wheezing children and 223 controls, ages 9–11, Nottingham. Paper ↗
124Saijo et al. (2022). Relations of mold, stove, and fragrance products on childhood wheezing and asthma: A prospective cohort study from the Japan Environment and Children's Study. Indoor Air. Birth cohort (JECS), 60,529 children. Paper ↗
125Wolkoff (2025). Formaldehyde and asthma: a plausibility?. Arch Toxicol. Narrative critical review. Paper ↗
126Rumchev et al. (2004). Association of domestic exposure to volatile organic compounds with asthma in young children. Thorax. Population-based case-control study (88 cases, 104 controls, ages 6 months to 3 years), with VOCs measured in living rooms. Paper ↗
127Wieslander et al. (1997). Asthma and the indoor environment: the significance of emission of formaldehyde and volatile organic compounds from newly painted indoor surfaces. Int Arch Occup Environ Health. ECRHS cross-sectional sample (n=562), with VOCs measured in 62 homes. Paper ↗
128Mendell (2007). Indoor residential chemical emissions as risk factors for respiratory and allergic effects in children: a review. Indoor Air. Review of 21 epidemiologic studies. Paper ↗
129Steinemann (2019). International prevalence of fragrance sensitivity. Air Qual Atmos Health. Nationally representative surveys in the US, Australia, UK and Sweden (about 1,100 adults each). Paper ↗
130Norbäck et al. (2017). Volatile organic compounds (VOC), formaldehyde and nitrogen dioxide (NO2) in schools in Johor Bahru, Malaysia: Associations with rhinitis, ocular, throat and dermal symptoms, headache and fatigue. Sci Total Environ. 462 students in 8 schools, with measurements. Paper ↗
131Takigawa et al. (2010). Relationship between indoor chemical concentrations and subjective symptoms associated with sick building syndrome in newly built houses in Japan. Int Arch Occup Environ Health. 1,479 residents of 425 new homes, with aldehydes and VOCs measured. Paper ↗
132Lang et al. (2008). Formaldehyde and chemosensory irritation in humans: a controlled human exposure study. Regul Toxicol Pharmacol. Double-blind, randomized repeated-measures chamber study (21 volunteers). Paper ↗
133Whitehead et al. (2017). Home remodeling and risk of childhood leukemia. Ann Epidemiol. California Childhood Leukemia Study case-control (609 ALL, 89 AML, 893 controls). Paper ↗
134Boor et al. (2014). Infant exposure to emissions of volatile organic compounds from crib mattresses. Environ Sci Technol. Chamber study of 20 new and used crib mattresses, including an infant thermal manikin. Paper ↗
135Ren et al. (2022). Associations between home renovation and asthma, allergic rhinitis, and eczema among preschool children in Wuhan, China. Int J Environ Health Res. Cross-sectional survey of 9,455 preschool children. Paper ↗
136Mallach et al. (2017). Exhaust ventilation in attached garages improves residential indoor air quality. Indoor Air. Randomized crossover trial in 33 Ottawa homes. Paper ↗
137Gordian et al. (2010). Evaporative gasoline emissions and asthma symptoms. Int J Environ Res Public Health. Survey of 509 Anchorage homes with attached garages, with BTEX measured for a week. Paper ↗
138Kang et al. (2024). Ventilation causing an average CO2 concentration of 1,000 ppm negatively affects sleep: A field-lab study on healthy young people. Building and Environment. Balanced field-laboratory intervention; 36 young healthy participants. Paper ↗
139Fan et al. (2023). A single-blind field intervention study of whether increased bedroom ventilation improves sleep quality. Science of the Total Environment. Balanced single-blind field intervention; 29 bedrooms over four weeks. Paper ↗
140Basner et al. (2023). Associations of Bedroom PM2.5, CO2, Temperature, Humidity and Noise with Sleep: an Observational Actigraphy Study. Sleep Health. Repeated-measures observational study; 62 adults monitored over 14 nights. Paper ↗
141Klausen et al. (2023). The effect of air quality on sleep and cognitive performance in school children aged 10-12 years: a double-blinded, placebo-controlled, crossover trial. Int J Occup Med Environ Health. Double-blind crossover, 36 children aged 10 to 12 sleeping in controlled bedrooms. Paper ↗
142Sundell et al. (2011). Ventilation rates and health: multidisciplinary review of the scientific literature. Indoor Air. Multidisciplinary review of 27 qualifying papers. Paper ↗
143Li et al. (2007). Role of ventilation in airborne transmission of infectious agents in the built environment: a multidisciplinary systematic review. Indoor Air. Systematic review of 40 studies, 10 judged conclusive. Paper ↗
144Zhu et al. (2020). Ventilation and laboratory confirmed acute respiratory infection (ARI) rates in college residence halls in College Park, Maryland. Environ Int. Prospective, two dorms, lab-confirmed infections. Paper ↗
145Du et al. (2020). Effect of ventilation improvement during a tuberculosis outbreak in underventilated university buildings. Indoor Air. Natural experiment, 27 TB cases and 1,665 contacts. Paper ↗
146Haddrell et al. (2024). Ambient carbon dioxide concentration correlates with SARS-CoV-2 aerostability and infection risk. Nat Commun. Laboratory aerosol levitation experiments plus transmission modeling. Paper ↗
147Buonanno et al. (2022). Increasing ventilation reduces SARS-CoV-2 airborne transmission in schools: A retrospective cohort study in Italy's Marche region. Front Public Health. Retrospective cohort, more than 10,000 classrooms, 316 with mechanical ventilation. Paper ↗
148Gettings et al. (2021). Mask Use and Ventilation Improvements to Reduce COVID-19 Incidence in Elementary Schools - Georgia, November 16-December 11, 2020. MMWR. CDC cross-sectional survey of 169 K-5 schools. Paper ↗
149Myatt et al. (2004). Detection of airborne rhinovirus and its relation to outdoor air supply in office environments. Am J Respir Crit Care Med. Field study with outdoor air supply adjusted on purpose. Paper ↗
150Seppänen et al. (1999). Association of ventilation rates and CO2 concentrations with health and other responses in commercial and institutional buildings. Indoor Air. Review of 20 ventilation studies (about 30,000 subjects) and 21 CO2 studies (more than 30,000 subjects). Paper ↗
151Apte et al. (2000). Associations between indoor CO2 concentrations and sick building syndrome symptoms in U.S. office buildings: an analysis of the 1994-1996 BASE study data. Indoor Air. Cross-sectional, a probability sample of 41 US office buildings. Paper ↗
152Hou et al. (2021). Associations of indoor carbon dioxide concentrations, air temperature, and humidity with perceived air quality and sick building syndrome symptoms in Chinese homes. Indoor Air. 1-year prospective bedroom monitoring, 165 homes across 5 climate zones. Paper ↗
153Norbäck & Nordström (2008). Sick building syndrome in relation to air exchange rate, CO2, room temperature and relative air humidity in university computer classrooms: an experimental study. Int Arch Occup Environ Health. Blinded crossover in classrooms, n=355. Paper ↗
154Wargocki et al. (2002). Ventilation and health in non-industrial indoor environments: report from a European multidisciplinary scientific consensus meeting (EUROVEN). Indoor Air. Consensus review, 105 papers screened, 30 judged conclusive. Paper ↗
155Allen et al. (2016). Associations of Cognitive Function Scores with Carbon Dioxide, Ventilation, and Volatile Organic Compound Exposures in Office Workers: A Controlled Exposure Study of Green and Conventional Office Environments. Environ Health Perspect. Double-blind chamber crossover, n=24, 6 full work days (COGfx Study 1). Paper ↗
156Satish et al. (2012). Is CO2 an indoor pollutant? Direct effects of low-to-moderate CO2 concentrations on human decision-making performance. Environ Health Perspect. Blinded chamber crossover, n=22, ultrapure CO2 injected at 600, 1,000 and 2,500 ppm, 2.5 h sessions. Paper ↗
157Herbig et al. (2026). Do carbon dioxide, volatile organic compounds and atmospheric pressure affect the cognitive performance of occupants in indoor environments? Results of a large-scale experiment with simulated flights. Int J Hyg Environ Health. Randomized controlled trial, 398 adults in simulated flights. Paper ↗
158Flagner et al. (2025). Cognition, economic decision-making, and physiological response to carbon dioxide. Indoor Environments. Randomized single-blind crossover experiment; 20 healthy adults; eight-hour exposures. Paper ↗
159Rodeheffer et al. (2018). Acute Exposure to Low-to-Moderate Carbon Dioxide Levels and Submariner Decision Making. Aerosp Med Hum Perform. Controlled exposure study, 36 submariners at 600, 2,500 and 15,000 ppm CO2. Paper ↗
160Scully et al. (2019). Effects of acute exposures to carbon dioxide on decision making and cognition in astronaut-like subjects. NPJ Microgravity. Controlled exposure study, 22 astronaut-like subjects at 600 to 5,000 ppm CO2. Paper ↗
161Wolkoff (2024). Indoor air humidity revisited: Impact on acute symptoms, work productivity, and risk of influenza and COVID-19 infection. Int J Hyg Environ Health. Review. Paper ↗
162Lowen et al. (2007). Influenza virus transmission is dependent on relative humidity and temperature. PLoS Pathog. Guinea pig transmission experiments, 20% to 80% RH. Paper ↗
163Kudo et al. (2019). Low ambient humidity impairs barrier function and innate resistance against influenza infection. PNAS. Mouse study (Iwasaki lab). Paper ↗
164Reiman et al. (2018). Humidity as a non-pharmaceutical intervention for influenza A. PLoS One. Prospective controlled trial in 4 preschool classrooms (2 humidified). Paper ↗
165Shaman & Kohn (2009). Absolute humidity modulates influenza survival, transmission, and seasonality. PNAS. Reanalysis of laboratory data. Paper ↗
166Myatt et al. (2010). Modeling the airborne survival of influenza virus in a residential setting: the impacts of home humidification. Environ Health. Multi-zone home model. Paper ↗
167Verheyen & Bourouiba (2022). Associations between indoor relative humidity and global COVID-19 outcomes. J R Soc Interface. Ecological study of 121 countries, with indoor RH estimated from weather data. Paper ↗
168Kormuth et al. (2018). Influenza Virus Infectivity Is Retained in Aerosols and Droplets Independent of Relative Humidity. Journal of Infectious Diseases. Laboratory aerosol and droplet experiment; Influenza A(H1N1) with material from primary human airway cells. Paper ↗
169Byber et al. (2021). Humidification of indoor air for preventing or reducing dryness symptoms or upper respiratory infections in educational settings and at the workplace. Cochrane Database Syst Rev. Cochrane review, 13 studies, at least 4,551 participants. Paper ↗
170Abusharha & Pearce (2013). The effect of low humidity on the human tear film. Cornea. Chamber crossover, 40% vs 5% RH for 60 min. Paper ↗
171Salah et al. (1988). Nasal mucociliary transport in healthy subjects is slower when breathing dry air. The European respiratory journal. Random-order controlled exposure experiment; 11 healthy nonsmokers. Paper ↗
172Engebretsen et al. (2016). The effect of environmental humidity and temperature on skin barrier function and dermatitis. J Eur Acad Dermatol Venereol. Review. Paper ↗
173Arita et al. (2024). Safety and Efficacy of Photocatalytic Micro-Mist Desktop Humidifier for Dry Eye Caused by Digital Environment: A Randomized Controlled Trial. Journal of clinical medicine. Randomized controlled trial; 31 participants performing one hour of screen work. Paper ↗
174Singh & Jaiswal (2013). Dehumidifiers for chronic asthma. Cochrane Database Syst Rev. Cochrane systematic review of dehumidification for asthma. Paper ↗
175WHO (2009). WHO Guidelines for Indoor Air Quality: Dampness and Mould. . Agency guideline. Paper ↗
176Mendell et al. (2011). Respiratory and allergic health effects of dampness, mold, and dampness-related agents: a review of the epidemiologic evidence. Environ Health Perspect. Comprehensive review. Paper ↗
177Fisk et al. (2007). Meta-analyses of the associations of respiratory health effects with dampness and mold in homes. Indoor Air. Meta-analysis. Paper ↗
178Lau et al. (2021). Particulate matter emitted from ultrasonic humidifiers: Chemical composition and implication to indoor air. Indoor Air. Lab plus whole-house experiment. Paper ↗
179Lee et al. (2026). Respiratory health risks associated with humidifier disinfectant exposure in South Korea: A systematic review and meta-analysis with exposure-response evaluation. J Expo Sci Environ Epidemiol. Meta-analysis of 17 observational studies. Paper ↗
180WHO (2023). Radon and health (fact sheet). World Health Organization. Agency fact sheet. Paper ↗
181Krewski et al. (2005). Residential radon and risk of lung cancer: a combined analysis of 7 North American case-control studies. Epidemiology. Pooled analysis of 7 North American case-control studies, 3,662 cases and 4,966 controls. Paper ↗
182Turner et al. (2011). Radon and lung cancer in the American Cancer Society cohort. Cancer Epidemiology, Biomarkers & Prevention. Prospective cohort (Cancer Prevention Study-II), 811,961 adults, 3,493 lung cancer deaths. Paper ↗
183IARC (1988). Radon (IARC Monographs Volume 43). IARC Monographs. IARC Working Group evaluation. Paper ↗
184Cheng et al. (2021). Systematic review and meta-analysis of residential radon and lung cancer in never-smokers. European Respiratory Review. Meta-analysis of 4 pooled studies (24 case-control studies), 2,341 never-smoker cases and 8,967 never-smoker controls. Paper ↗
185Lorenzo-González et al. (2019). Lung cancer and residential radon in never-smokers: A pooling study in the Northwest of Spain. Environmental Research. Pooled case-control studies of never-smokers, 523 cases and 892 controls. Paper ↗
186Raaschou-Nielsen et al. (2008). Domestic radon and childhood cancer in Denmark. Epidemiology. Registry-based case-control study in Denmark, 2,400 cases and 6,697 controls. Paper ↗
187Hauri et al. (2013). Domestic radon exposure and risk of childhood cancer: a prospective census-based cohort study. Environmental Health Perspectives. Nationwide census-based cohort of Swiss children under 16, 997 cancer cases. Paper ↗
188Turner et al. (2012). Radon and COPD mortality in the American Cancer Society Cohort. European Respiratory Journal. Prospective cohort (Cancer Prevention Study-II), 811,961 adults, 28,300 non-malignant respiratory deaths. Paper ↗
We walk through your home, measure the air room by room and overnight in the bedrooms, and give you a short list of changes, along with everything else we test in your home.








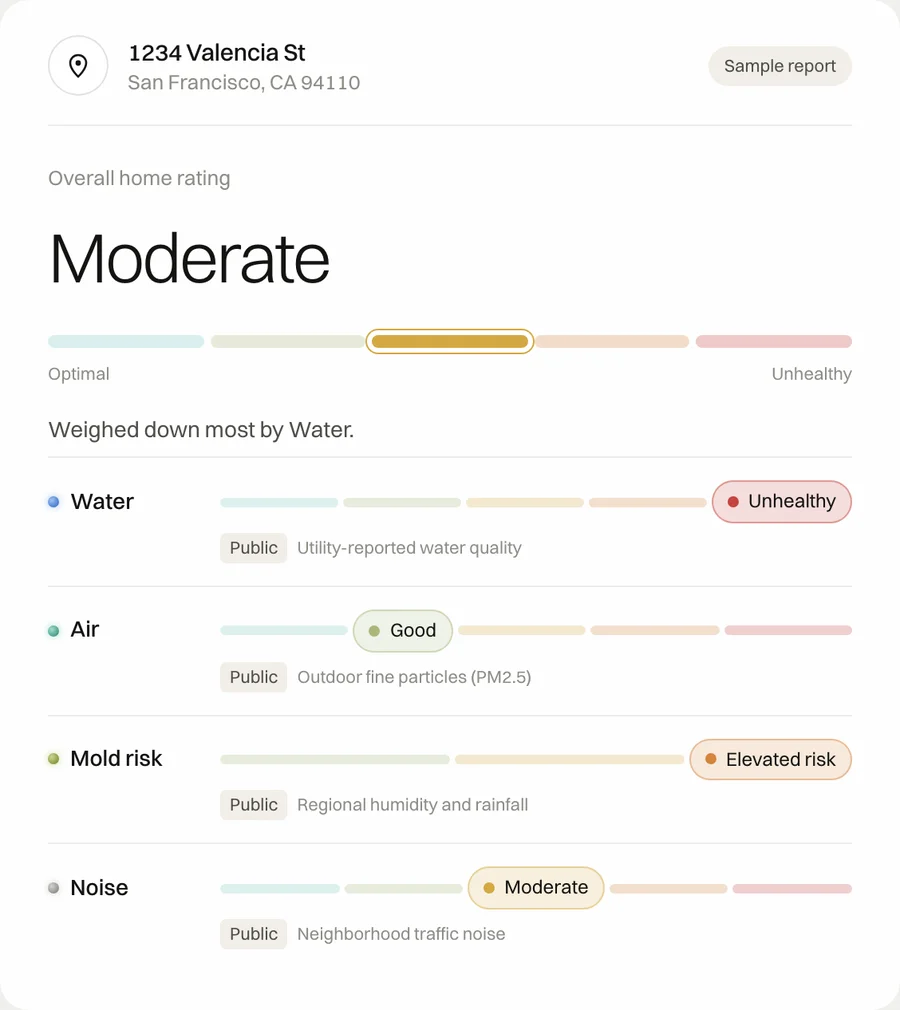 Get your free personalized home report.